
D.23 | Target (TGT): “Tarzhay” Through The Cycle // Mar 2026
By zachgedal
Published on March 9, 2026
Howdy, fellow investor! Welcome back to Gedal Notes.
If you’ve been following our Dividend Centurions series, you know we spend a lot of time hunting for pristine, straight-line compounding machines. We’ve looked at the ultra-predictable consumer staples dynamics of Coca-Cola (KO) and the relentless, wide-moat, life-sciences compounding of Thermo Fisher Scientific (TMO).
Today, we are going to use that exact same narrative style, but we are tuning our lens to a very different kind of animal. We aren’t looking at a defensive staple or a lab-tools compounder. Today, we are looking at a highly cyclical, big-box mass merchant: Target Corporation (NYSE: TGT).
Target sits in a profoundly strange, highly polarized place in early 2026.
On the one hand, it is an elite income asset. It boasts an exceptional, elite track record of increasing its annual dividend for a staggering 54 consecutive years, officially crowning it a Dividend King. The latest increase, announced going into 2026, extends that streak and pushes the quarterly dividend to $1.14 per share (an annualized run rate of $4.56). With the stock navigating daily volatility in the $115–$120 range, that translates to a robust forward dividend yield hovering between 4.0% and 4.4%—a massive premium compared to its retail peers. Dividend rating outfits give Target very high marks for safety, and they aren’t doing that out of mere nostalgia.
On the other hand, the business is coming off a brutal multi-year crucible. After a pandemic-era sales surge pushed annual revenues past the $100 billion threshold for the first time in company history, Target walked straight into a perfect macroeconomic storm. Disastrously wrong inventory buys in 2022 led to massive, margin-crushing markdowns. An inflation-weary consumer aggressively pulled back on discretionary spending throughout 2024. Organized retail crime (shrink) peaked at a staggering $1.2 billion. And frankly, polarizing culture-war blowback did real, measurable damage to foot traffic and brand sentiment.
Right now, the market is treating Target like a damaged cyclical stock, assigning it a trailing P/E ratio near 10x—far below its ten-year average of roughly 16x. But for our Dividend Centurions framework, this is exactly the kind of setup we hunt for. We want resilient, cash-gushing businesses with half-century dividend records that periodically fall out of favor because the short-term fundamentals look messy.
Target is not a straight-line compounder. It is a highly complex, omnichannel fulfillment engine with a massive brand footprint, genuine execution scars, and—as of February 2026—a brand-new CEO executing a massive $6 billion turnaround.
The key question for our D.23 slot is simple: Does Target have the staying power, the margin resilience, and the corporate culture to keep this dividend train running for decades more while gradually pushing earnings back to their pre-2022 profile?
Grab your coffee and your portfolio. Let’s tear this enterprise down to the studs.
Part I: The Corporate Genesis and the “Tarzhay” Identity (1902–2000s)
To understand why Target still commands massive cultural mindshare—and why it possesses a genuine economic moat that its rivals lack—you have to go all the way back to the traditions of old-school department store capitalism.
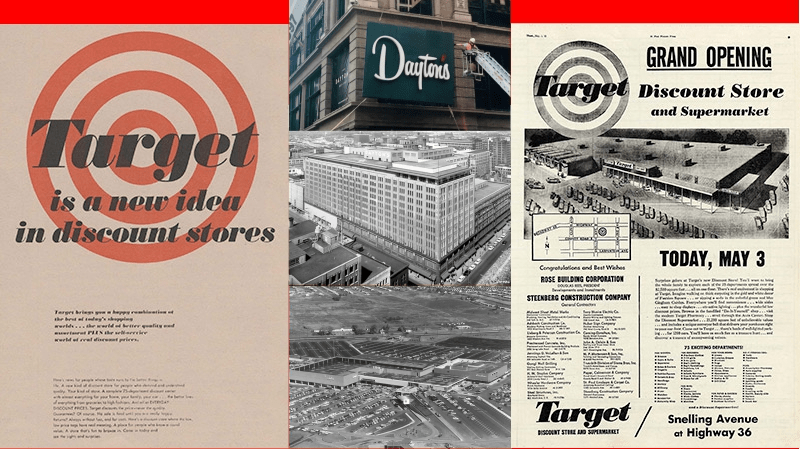
The corporate DNA traces its roots to June 24, 1902, when George Dayton founded Goodfellow Dry Goods in Minneapolis, which rapidly evolved into the Dayton Company. For the first half of the 20th century, Dayton’s operated as a premier regional department store in the Midwest, building immense institutional expertise in softlines, apparel, and high-touch customer service.
The critical strategic inflection point occurred in the early 1960s. Recognizing a post-war demographic shift toward suburban living and the undeniable rise of discount retail, the Dayton family worked with executive John F. Geisse to conceptualize a completely new format: “upscale discount retailing.”
On May 1, 1962—the exact same year its greatest historical rivals, Walmart and Kmart, were founded—the first Target store opened in Roseville, Minnesota. Target’s deliberate strategy was to elevate the discount experience. Through wider aisles, superior lighting, and a higher quality of merchandise presentation, Target effectively created a middle ground between the traditional, high-margin department store and the stark, bare-bones discount warehouse. They visually codified this with the original concentric red bullseye logo (streamlined to its modern look in 1968).
To fuel aggressive geographical expansion, the company IPO’d on October 18, 1967, debuting at $34 a share. Through highly synergistic mergers—forming the Dayton-Hudson Corporation in 1969 and acquiring chains like Marshall Field’s and Mervyn’s—the conglomerate used the massive cash flows from its legacy department stores to subsidize Target’s national rollout. They constantly innovated their physical footprint, launching the “Target Greatland” superstore in 1990, the grocery-integrated “SuperTarget” in 1995, and its highly lucrative proprietary credit card business (the Target Guest Card) that same year.
By the turn of the millennium, the discount arm had so thoroughly eclipsed the legacy stores in both revenue and cultural relevance that the parent entity officially renamed itself Target Corporation in January 2000.
The “Cheap Chic” Era & The $30 Billion Owned-Brand Moat
Through the 1990s and early 2000s, Target carved out a deeply unique brand positioning. By differentiating itself from Walmart’s strict focus on absolute lowest cost, Target cultivated a reputation for “cheap chic.” Groundbreaking, exclusive collaborations with high-end designers like Isaac Mizrahi, Zac Posen, and Jason Wu fundamentally altered consumer expectations, proving that discount retailing did not require a sacrifice of aesthetic value. Shoppers affectionately nicknamed it “Tarzhay”—a mock-French pronunciation reflecting its mix of affordable prices and surprising style.
This isn’t just a fun marketing anecdote; it is the structural foundation of Target’s competitive moat. Today, Target boasts a highly lucrative portfolio of more than 40 exclusive private-label brands. According to analysis by the Yale School of Management, these owned brands generate over $30 billion in annual sales—nearly one-third of the company’s total revenue.
- Eleven of these brands individually generate over $1 billion.
- Four marquee labels (Good & Gather for food, Cat & Jack for kids, Up & Up for essentials, and Threshold for home decor) are each near or above $3 billion in annual sales.
These brands are designed in-house. They carry significantly higher margins than national brands, and most importantly, they create switching costs. Walmart can undercut Target on the price of a generic commodity, but if a family falls in love with the fit, durability, and style of a Cat & Jack outfit, they have to cross the physical or digital threshold of a Target store to get it.
Part II: Operational Stress Tests and the Scars of Evolution
A 54-year dividend streak does not happen without surviving profound corporate crises. For a Dividend Centurion, we don’t just want to look at the successes; we need to see how a company handles a nightmare. Target has survived several, which act as crucial learning mechanisms.
The 2013 Double-Hit: Canada and the Data Breach
In 2013, Target launched an extraordinarily ambitious international expansion into Canada. It was a catastrophic failure, plagued by severe supply chain miscalculations, widespread inventory stockouts, and a fundamental failure to meet the pricing expectations of Canadian consumers. By 2015, an embattled management team was forced to liquidate and close all Canadian locations, absorbing billions in losses.
Concurrently, during the Q4 2013 holiday shopping season, Target suffered one of the most highly publicized cybersecurity breaches in global retail history. Intruders stole the payment card data of more than 70 million customers. Target recognized direct data breach expenses of $61 million in Q4 2013, $230 million in Q1 2014, and $148 million in Q2 2014. The breach crushed foot traffic and introduced massive volatility into Target’s lucrative consumer credit card portfolio.
However, this crisis served as a mandatory catalyst. Target deployed hundreds of millions to update security technology and rebuild data centers—a forced maturation of its digital backbone that ultimately saved the company later in the decade.
The 2022 Inventory Apocalypse
More recently, Target suffered a massive self-inflicted wound. Following an unprecedented expansion during the 2020–2021 pandemic boom, Target over-ordered discretionary stock (like patio furniture, home decor, and electronics) just as shoppers—squeezed by inflation—shifted back toward services and basic groceries. To clear the warehouses, Target had to execute aggressive markdowns. Operating margins plunged from an elite 8.4% in 2020 down to a dismal 3.5% in 2022. Earnings per share collapsed from over $14.00 down to roughly $6.00.
Yet, here is the defining takeaway for the income investor: Even in 2022, when earnings dropped by more than half, Target still raised its dividend. They didn’t even flirt with a cut. That tells you exactly how seriously the Board of Directors treats this half-century streak.
Part III: The Omnichannel Transformation & “Stores-as-Hubs”
By 2017, the existential threat posed by Amazon’s logistical supremacy and the broader narrative of the “retail apocalypse” forced then-CEO Brian Cornell into an aggressive defensive posture. Rather than attempting to build massive, centralized “dark” e-commerce distribution centers to match Amazon, Cornell committed $7 billion to a brilliant, contrarian strategy.
The centerpiece of this pivot was the rapid acquisition of last-mile delivery infrastructure. In late 2017, Target acquired Grand Junction (routing software) and executed a transformative $550 million all-cash acquisition of Shipt, a same-day delivery platform powered by a gig-economy network of over 20,000 “shoppers.”
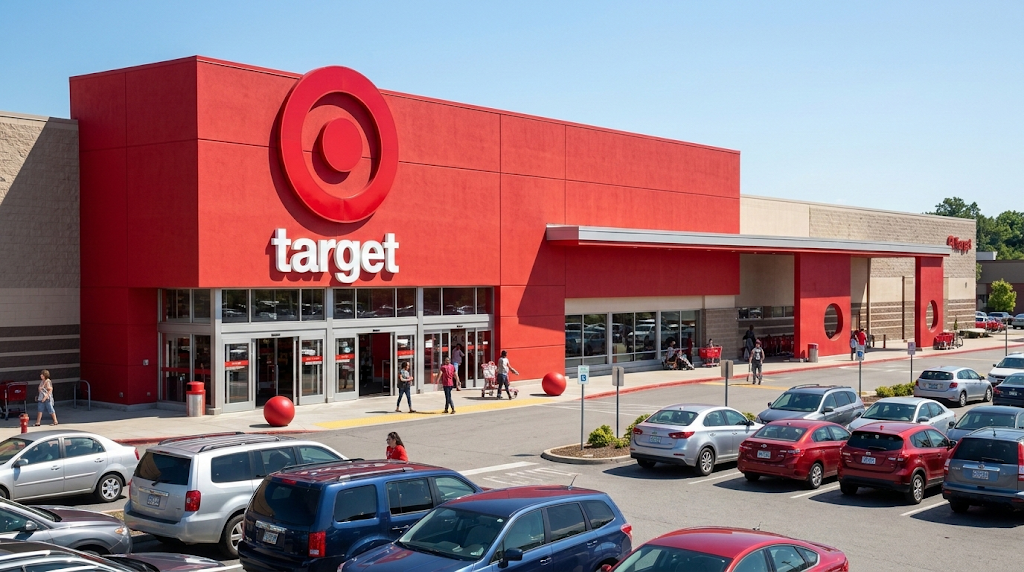
This birthed Target’s defining modern operational characteristic: “Stores-as-Hubs.” Target realized its greatest logistical asset was its physical real estate. Roughly 75% of the U.S. population lives within a 10-mile radius of a Target. The company decided to use its roughly 1,989 retail locations as localized micro-fulfillment nodes.
As of early 2026, an absolutely staggering 96% to 97% of all of Target’s digital sales volume is fulfilled directly by its physical stores, operating across multiple consumer touchpoints:
- In-Store Order Pickup (BOPIS): Customers purchase online and retrieve items at dedicated service counters.
- Drive Up: Curbside delivery executed by Target personnel, highly popular for everyday essentials.
- Target Last Mile Delivery (TLMD) via Shipt: Same-day delivery direct to the consumer’s doorstep.
The unit economics of this localized model represent a massive competitive advantage. Fulfilling an e-commerce order using pre-existing store inventory saves the company approximately 40% per package compared to the exorbitant freight costs of shipping from a dedicated, upstream distribution center.
To refine this and relieve store backroom congestion, Target built localized “Sortation Centers.” Store employees pick digital orders, which are swept multiple times a day to local sortation centers. There, proprietary tech batches orders by zip code, radically increasing delivery density and saving the company over $30 million annually in last-mile carrier fees. In late 2025 alone, Target delivered over 2 million more packages the next day than the prior year, with over 70% of digital orders fulfilled within a single day.
Part IV: Macroeconomic Stress Tests & Fiscal 2025 Financial Reality
To accurately evaluate Target’s financial posture as of March 2026, we have to look unblinkingly at the severe pressures of the preceding 24 months.
Target is a general merchandise retailer broadly diversified across five categories: Apparel & Accessories, Beauty & Household Essentials, Food & Beverage, Home Furnishings & Decor, and Hardlines. Crucially, between 40% and 50% of Target’s sales are derived from discretionary categories.
When inflation squeezed American wallets in 2023 and 2024, consumers prioritized groceries and pulled back hard on home decor and apparel. This hit Target significantly harder than staple-heavy rivals like Walmart. Target suffered an earnings nadir in mid-2024, plagued by a “value perception gap”—accused of being overpriced compared to competitors. To combat this, they launched the Dealworthy brand (items primarily under $10) and slashed prices on 5,000 essential items. Furthermore, inventory loss due to organized retail crime (“shrink”) peaked at $1.2 billion in 2023, acting as a massive drag on gross margins before increased security brought it down to roughly $500 million by 2025.
Fiscal 2025 Financial Results: Stabilization & Margin Resilience
Target’s full-year 2025 financial results, reported on March 3, 2026, reflect a company stabilizing its operations after executing a strict $2 billion efficiency program:
| Key Financial Metric | Full-Year 2025 | Full-Year 2024 | Year-over-Year Change |
| Net Sales | $104.8 Billion | $106.6 Billion | (1.7%) |
| Comparable Sales | – | – | (2.6%) |
| GAAP EPS | $8.13 | $8.86 | (8.2%) |
| Adjusted EPS | $7.57 | $8.86 | (14.5%) |
| Operating Income | $5.1 Billion | $5.6 Billion | (8.1%) |
| Operating Margin | 4.9% | 5.2% | (30 bps) |
| Gross Margin Rate | 27.9% | 28.2% | (30 bps) |
| After-Tax ROIC (TTM) | 13.8% | 15.4% | (160 bps) |
Data Source: Target Corporation Fourth Quarter and Full-Year 2025 Earnings Report.
While top-line net sales declined by 1.7% to $104.8 billion, the underlying margin profile showed extreme resilience in a terrible retail macro environment. Generating an After-Tax Return on Invested Capital (ROIC) of 13.8% is vital. You want a company that is not just limping along, but actually earns a clear spread between its ROIC and its cost of capital. That spread is what funds the dividend. Notably, Q4 2025 saw traffic trends finally accelerate, with Food, Beauty, and Toys delivering net sales growth.
The Margin Subsidy: Roundel and Target Circle 360
How is Target maintaining a ~5% operating margin despite massive price cuts on physical goods? The answer lies in the structural transformation of its revenue mix. Target is aggressively monetizing its digital ecosystem. Revenue from non-merchandise sources grew by more than 25% in the fourth quarter of 2025.
This explosive growth is anchored by Roundel, Target’s proprietary retail media network. By selling highly targeted digital advertising space to its vendors on https://www.google.com/search?q=Target.com and within its app, Roundel acts as a pure-profit center. The ad business reached nearly $2 billion in value in 2025 and is projected by analysts to scale to $4 billion by 2030.
Furthermore, membership revenue more than doubled year-over-year, driven by the aggressive scaling of the paid Target Circle 360 delivery subscription program, while revenue from Target Plus (its third-party digital marketplace) grew over 30%. These alternative revenue streams act as a vital margin subsidy, providing the financial cushion that allows Target to lower physical prices to drive foot traffic without destroying consolidated operating income.
Part V: The 2026 Strategic Recalibration: The Michael Fiddelke Era
The beginning of fiscal 2026 marked a massive, generational leadership transition. On February 1, 2026, Michael Fiddelke—a 23-year company veteran and former CFO/COO—officially succeeded Brian Cornell as Chief Executive Officer.
Fiddelke wasted no time. During the March 2026 financial community meeting, he announced a comprehensive $6 billion multi-year turnaround strategy, anchored by a bold, refreshing philosophical pivot:
“Target is not an everything store. That’s not what guests want from us.”
This represents a deliberate strategic retreat. Target is officially stepping out of the infinite-SKU arms race with Amazon and the pure lowest-cost war with Walmart. Instead, Target is doubling down on “merchandising authority”—curated, culturally relevant assortments that win on style, design, and value. To reclaim its “Tarzhay” magic, the company is explicitly focusing its capital on three core categories: Home, Baby, and Beauty.
Capital Allocation and the $2 Billion Incremental Investment
To execute this vision, management committed to a massive $2 billion incremental investment in 2026, split evenly between structural improvements and operational enhancements:
- $1 Billion Increase in CapEx: Target plans to open more than 30 new stores in 2026 (including its 2,000th location in Fuquay-Varina, N.C.) and add 300 new stores by 2035. The CapEx will fund the largest store transformation in a decade, updating floor plans across the chain. This includes building premium “Target Beauty Studios” in over 600 stores and launching premium baby boutiques featuring high-end partnerships with brands like UPPAbaby, Bugaboo, Doona, and Stokke.
- $1 Billion Incremental OpEx: To fix the broken, cluttered in-store experience that alienated customers in 2024, Target is deploying hundreds of millions into additional store payroll and comprehensive employee training. They are also vastly increasing spend on brand marketing and accelerating the integration of Artificial Intelligence (AI) to improve digital discovery and personalize the Target Circle loyalty program.
Management projects cautious optimism for FY2026: net sales growth around 2%, operating margin expansion of ~20 basis points above the 2025 adjusted rate, and GAAP/Adjusted EPS projected between $7.50 and $8.50. Early indicators suggest market approval, as Target stock surged over 7% following the announcement.
Part VI: Exhaustive Dividend Analysis & Capital Stewardship
For institutional investors, pension funds, and us Dividend Centurion architects, Target is fundamentally defined by its capital stewardship.
A Half-Century of Uninterrupted Dividend Growth
As of March 2026, Target boasts an exceptional, elite track record of increasing its annual dividend for 54 consecutive years (and 232 consecutive dividend payments since going public in 1967).
This streak indicates extreme cash flow durability. The dividend survived the stagflation of the 1970s, the double-digit interest rates of the early 80s, the dot-com bust, the 2008 Great Financial Crisis, the 2013 data breach, the retail apocalypse narrative of the 2010s, the COVID-19 pandemic, and the 2022 inventory collapse.
To contextualize the magnitude of this compounding growth: Target’s annual dividend payout was a mere $0.60 per share in 2008. Over the ensuing decade, the payout expanded exponentially, reaching $2.52 by 2018, jumping to $3.96 by 2022, and hitting an annualized rate of $4.44 in 2024. In the fourth quarter of 2025, Target paid $516 million in dividends ($1.14 per share), establishing a forward annualized dividend of $4.56 per share for fiscal year 2026.
Yield, Growth Rates, and the Strategic Payout Ratio
At current share prices fluctuating around $115–$120, Target provides a robust forward yield of 4.02% to 4.39%. This massively outpaces the broader market, the 3% consumer defensive average, and Walmart’s ~1.5% yield.
However, a granular look shows that dividend growth has recently decelerated:
- 10-Year Trailing Average CAGR: 7.82%
- 5-Year Trailing Average CAGR: 11.09%
- 3-Year Trailing Average CAGR: 5.98%
- 1-Year Trailing Growth (2025 to 2026): 1.81%
This sub-2% hike for 2026 is a highly deliberate, mathematically sound maneuver. Target currently operates with a payout ratio of roughly 54.8% (distributing just over half of its net earnings as dividends).
Because CEO Michael Fiddelke requires a massive $2 billion incremental capital injection to execute his turnaround plan, the Board responsibly throttled the dividend growth rate to preserve necessary Free Cash Flow. The dividend is safely intact and heavily covered by $7+ billion in annual operating cash flow, but aggressive hikes have been temporarily sacrificed to fund the operational modernization required to drive future top-line growth. This is the exact kind of disciplined capital allocation you want to see.
Balance Sheet, Buybacks, & ESG Dynamics
From a balance sheet perspective, Target is conservatively levered. It maintains a Debt-to-Equity ratio of roughly 1.29. S&P Global recently assessed their unsecured notes with an ‘A’ rating, projecting adjusted leverage to remain safely below 2.0x. They hold a $1.0 billion 364-day revolving credit facility alongside a $3.0 billion master facility. Furthermore, while share repurchases were tactically paused in late 2025 to preserve the balance sheet, Target still holds a massive arsenal of **$8.3 billion** in remaining authorized buyback capacity—providing massive “dry powder” to shrink the float once operations normalize.
A contemporary analysis must also note Target’s integration of ESG. Through its “Target Forward” initiative, the company has pledged to become a net-zero enterprise by 2040 (launching its first net-zero energy store in 2022) and maintains a historical policy of committing 5% of pre-tax profits back to local communities. However, navigating the increasingly polarized American sociopolitical landscape has proven highly volatile. Significant cultural backlash and consumer boycotts regarding merchandising decisions in the mid-2020s did real damage to brand sentiment, leading to a corporate retrenchment in some DEI initiatives by 2025. This underscores the inherent risk of mass-market brand positioning, forcing Fiddelke’s team to refocus entirely on merchandise quality, aesthetic inspiration, and value delivery.
Part VII: Peer Context & Valuation Scenarios (The Baseball Lineup)
Within your broader portfolio, you will naturally compare Target to other large retail Centurions. If we think of our Dividend Centurions series as a baseball lineup:
- Walmart (WMT) is the steady lead-off hitter who always gets on base. It has deeper grocery penetration and a relentless everyday-low-price model, offering massive defensive stability. But investors pay a premium for that safety; the yield is tiny (~1.5%) and the valuation is demanding.
- Costco (COST) is the cleanup slugger. Its membership model provides incredibly high-margin revenue and locks in loyalty, leading to occasional huge home runs via massive special dividends. However, it trades at an astronomical, staple-like multiple.
- Target (TGT) is the streaky middle-order bat. It is not as price-relentless as Walmart, nor as membership-anchored as Costco. Instead, it offers a curated, design-driven experience. It will have very good seasons and occasional slumps.
At a trailing P/E of roughly 10x, what is the market pricing in over the next decade?
- The Bear Case (Structural Decline): Target never solves its assortment, pricing, and brand issues. Younger shoppers drift permanently to Amazon or fast-fashion competitors. Culture war blowback continues. Margins compress to low single digits and ROIC slips toward the cost of capital. The board clings to the dividend streak until it becomes mathematically impossible, forcing a freeze or a cut. Given the real estate, the massive cash flow, and the historical adaptability of the company, this is highly unlikely, but not impossible.
- The Bull Case (Successful Tarzhay Renewal): Fiddelke’s “Not an everything store” strategy works perfectly. Store remodels make locations feel bright and curated. Premium beauty and baby boutiques drive massive traffic. Owned brands expand margins. Shrink is mitigated. The $4 billion Roundel ad network scales perfectly. Sales grow 3-4% annually, operating margins return to the 7% range, and EPS grows double-digits. The market re-rates the P/E multiple back to its historical 15x-16x. You capture massive capital appreciation plus a 4%+ starting yield.
- The Base Case (Muddle Through): Target gradually repairs traffic and margin without magic. Sales grow 1-3% annually. Operating margins grind back toward 5-6% as promotional pressures offset efficiency gains. Earnings grow at 5-8% through the cycle. The company generates enough cash to maintain the dividend, but payout ratios creep toward 65%. The market values it at a 12-14x P/E. Combined with the 4%+ starting yield, your expected total return lives comfortably in the low double-digits.
Closing Synthesis: Does Target Deserve a Centurion Slot?
Time to answer the ultimate question in plain language.
Target is not a pristine compounding machine like Thermo Fisher, nor is it an ultra-predictable consumer staple like Coke. It is a messy, very human retailer that occasionally faceplants, takes its lumps, and then scrambles back to its feet.
Yet, over half a century, it has always managed to keep writing bigger dividend checks. Through stagflation, recessions, the rise of Walmart, the birth of e-commerce, and deep internal, self-inflicted crises—your dividend from Target has marched higher. That is the exact mathematical proof of durability we screen for.
Right now, you are being offered that 54-year streak at a ~4%+ yield because the market is understandably frustrated with the recent macroeconomic slump and nervous about the near-term outlook. But the underlying financial architecture is unshakeable: $104.8 billion in trailing annual revenue, a 13.8% ROIC, a printing-press ad business in Roundel, and a localized fulfillment network that slashes delivery costs.
As a business, Target sits in a more fragile competitive position than your pure wide-moat giants. Retail is unforgiving, and you should expect volatility. But as a dividend vehicle, Target is already a Centurion in spirit and in fact. The culture around the dividend is ironclad.
At a ~10x P/E, Target is a masterclass in what a Dividend Centurion looks like when it lives in a rough neighborhood. If you can live with the retail volatility, the combination of current yield and the potential for a strategic recovery makes it a highly compelling asset. You are essentially being paid a premium yield to wait for the turnaround.
Verdict: Target absolutely earns its stripes. Welcome to the portfolio.
Target Corporation: A Comprehensive Analysis of Corporate Evolution, Financial Resilience, and Dividend Stewardship
Introduction
Within the complex, highly competitive, and rapidly consolidating landscape of the American retail sector, few entities demonstrate the historical adaptability, brand equity, and sustained financial resilience of Target Corporation. Operating at the unique intersection of mass-market convenience and aspirational merchandising—a positioning that has colloquially earned it the moniker “Tarzhay”—Target has historically differentiated itself from pure-play discount competitors like Walmart and pure-play digital monoliths like Amazon. As of early 2026, the Minneapolis-based enterprise generates annual revenues exceeding $100 billion, commands a physical footprint of nearly 2,000 stores across the United States, and employs a highly sophisticated omnichannel fulfillment architecture.
However, beyond its merchandising prowess, Target is fundamentally defined by its elite status as a Dividend Aristocrat. The company has executed a 54-year streak of consecutive annual dividend increases, a testament to its cash flow durability through multiple macroeconomic cycles, technological disruptions, and internal crises. This exhaustive research report presents a deep, structural analysis of Target Corporation. By tracing its genesis from a regional Midwestern dry goods business to a global retail powerhouse, evaluating its strategic format transitions, and thoroughly dissecting its modern financial architecture and capital stewardship, this document provides a nuanced understanding of Target’s operational mechanics. Particular emphasis is placed on the macroeconomic pressures of the 2024–2025 period, the 2026 strategic recalibration under new leadership, and the underlying mechanics of its vaunted dividend sustainability.
Part I: Corporate Genesis and the Expansion of Format (1902–1999)
From Dry Goods to Upscale Discount Retailing
The structural DNA and merchandising philosophy of Target Corporation are deeply rooted in the traditions of full-line department store retailing. The enterprise was founded on June 24, 1902, as Goodfellow Dry Goods by George Dayton, before rapidly rebranding to the Dayton’s Dry Goods Company in 1903, and subsequently the Dayton Company in 1910. For the first half of the 20th century, the Dayton Company operated as a premier regional department store in the Midwest, building immense operational expertise in softlines, apparel, and high-touch customer service. This legacy department store background fundamentally influenced the company’s future approach to discount retailing, ensuring an emphasis on store aesthetics that its competitors lacked.
The critical strategic inflection point in the company’s history occurred in the early 1960s. Recognizing a post-war demographic shift toward suburban living and an opening in the market for what executive John F. Geisse conceptualized as “upscale discount retailing,” the company pivoted. On May 1, 1962, under the guidance of Geisse and Douglas Dayton, the first Target store officially opened in Roseville, Minnesota, a suburb of St. Paul. By the end of 1962, the company had successfully launched four Target locations across Minnesota (Roseville, Crystal, Duluth, and St. Louis Park).
This 1962 launch coincided almost exactly with the founding of its two greatest historical rivals: Walmart and Kmart. However, Target’s deliberate strategy was to elevate the discount experience. Through wider aisles, superior lighting, and a higher quality of merchandise presentation, Target effectively created a middle ground between the traditional, high-margin department store and the stark, bare-bones discount warehouse. To visually codify this identity, the company introduced its original concentric bullseye logo in 1962, which was subsequently streamlined to a more modern, single-ring design in 1968 to reflect a cleaner aesthetic.
Strategic Mergers, IPO, and National Saturation
To fuel aggressive geographical expansion, the parent entity transitioned to the public equity markets, executing an initial public offering (IPO) on October 18, 1967, as the Dayton Corporation, debuting at $34 a share. The influx of public capital enabled the company to set a national expansion plan, launching its first stores outside of Minnesota with two units in Denver, Colorado, in 1966, followed by expansion into St. Louis, Missouri, in 1968.
The company achieved massive scale and operational leverage through aggressive structural consolidation. In 1969, the Dayton Corporation executed a highly synergistic merger with the J.L. Hudson Company, a prominent Detroit-based non-food retail rival, forming the Dayton-Hudson Corporation. This newly minted retail conglomerate operated an expansive and diverse portfolio that included Target discount stores alongside legacy department store chains such as Dayton’s, Hudson’s, Marshall Field’s (which was later acquired from Batus Inc. in 1990), and Mervyn’s. Furthermore, in 1969, the conglomerate acquired the Boston-based Lechmere electronics and appliances chain to penetrate New England, as well as the Philadelphia-based jewelry chain J.E..
Throughout the 1970s and 1980s, the Dayton-Hudson Corporation utilized the substantial cash flow generated by its legacy department stores to subsidize the nationwide expansion of the Target brand. By 1970, Target Stores had added seven new units, reached $200 million in sales, and was rapidly becoming the growth engine of the conglomerate. Notably, during this era, Target established a history of progressive corporate policies, becoming one of the earliest companies in the retail industry to actively promote women to executive roles in the 1970s.
The expansion strategy became highly aggressive in the late 1980s. In 1987, Dayton-Hudson acquired closed Gemco units, retrofitted them, and reopened them as Target stores. This maneuver allowed Target to aggressively enter the Michigan and Nevada markets—specifically opening six new units in Detroit to compete directly in the backyard of rival Kmart. By the close of 1987, Target operated 317 units across 24 states, generating a massive $5.3 billion in annual sales (equivalent to roughly $12.5 billion in 2024 adjusted dollars).
The Evolution of Store Typologies
As consumer behavior shifted and suburban real estate footprints expanded, Target continuously pioneered various store formats to capture different purchasing missions. The standard Target property was established at roughly 135,000 square feet, designed to sell a balanced mix of hardlines (electronics, toys) and softlines (apparel, home goods).
Seeking to capture a larger share of the consumer wallet, the company launched the “Target Greatland” concept in 1990, opening the first general merchandise superstore in Apple Valley, Minnesota. Recognizing the frequency-driving power of groceries, the company evolved this concept further in 1995 with the introduction of the first “SuperTarget” in Omaha, Nebraska. This massive format integrated a full grocery section and coincided with the launch of the company’s proprietary grocery brand, Archer Farms.
This era also saw the genesis of Target’s highly lucrative financial services division. The company introduced its first proprietary store credit card, the Target Guest Card, in 1995. Recognizing the value of consumer credit data and financing revenue, Target expanded this by releasing the Target Visa Credit Card in 2001, which eventually evolved into the comprehensive Target RedCard ecosystem in 2004.
By the turn of the millennium, the Target discount division had vastly eclipsed the legacy department stores in both revenue generation and cultural relevance. Acknowledging this permanent shift in the corporate center of gravity, the Dayton-Hudson Corporation officially announced a name change to Target Corporation in January 2000, aligning its corporate identity perfectly with its core business driver.
Part II: The 21st Century Transition and Operational Stress Tests (2000–2020)
The “Cheap Chic” Era and Unprecedented Revenue Milestones
The early 2000s cemented Target’s unique brand identity as the premier destination for design-forward, affordable merchandise. By differentiating itself from Walmart’s strict focus on lowest absolute cost, Target cultivated a reputation for “cheap chic”. This was achieved through groundbreaking, exclusive collaborations with high-end designers such as Isaac Mizrahi, Zac Posen, and Jason Wu. This strategy fundamentally altered consumer expectations, proving that discount retailing did not require a sacrifice of aesthetic value or trend relevance.
Financially, this merchandising strategy yielded immense returns. While it took the company 30 years to reach its first $10 billion in annual sales, Target surpassed the $50 billion annual sales milestone in 2005, just 13 years later.
To sustain growth and penetrate dense urban markets where massive 135,000-square-foot suburban properties were economically unfeasible, Target pioneered small-format stores. The company introduced the “CityTarget” and “TargetExpress” models beginning in 2012. These highly curated, localized stores provided a critical growth vector, allowing Target to capture affluent urban professionals and college campus demographics.
Operational Missteps: The Canadian Failure and the 2013 Data Breach
The corporate history of Target Corporation is not without profound strategic errors, which serve as crucial learning mechanisms for its modern executive framework. In 2013, the company launched an extraordinarily ambitious international expansion into Canada. However, this initiative was plagued by severe supply chain miscalculations, widespread inventory stockouts, and a fundamental failure to meet the pricing expectations of Canadian consumers. The operational bleeding was severe; by 2015, an embattled Target management team was forced to liquidate and close all Canadian locations, absorbing billions in losses and retreating entirely to its domestic operations.
Concurrently, Target suffered an unprecedented domestic crisis. During the critical fourth-quarter holiday shopping season of 2013, the company experienced one of the most highly publicized cybersecurity breaches in global retail history. Intruders infiltrated the company’s point-of-sale systems, stealing the payment card data of more than 70 million customers. The financial and reputational damage was immediate and severe.
Target recognized total data breach expenses of $61 million in Q4 2013 (offset slightly by a $44 million insurance receivable), followed by an additional $230 million in Q1 2014 and $148 million in Q2 2014. Beyond the direct costs of litigation and consumer remediation (such as offering free credit screening services), the breach severely depressed foot traffic and consumer confidence. Furthermore, it introduced massive volatility into Target’s credit card portfolio. Although Target had previously sold its consumer credit card receivables portfolio to TD Bank Group, the companies operated under a profit-sharing agreement; the breach threatened to suppress the volume of new credit accounts and the ability of cardholders to maintain balances, threatening this high-margin revenue stream.
However, this crisis served as a mandatory catalyst for technological modernization. Target invested aggressively to protect its infrastructure from future attacks, deploying $100 million specifically to update security technology, rebuild data centers, and implement advanced customer service protocols. This forced maturation of its digital and technological backbone ultimately laid the structural groundwork for the e-commerce fulfillment network that would save the company later in the decade.
Part III: The Omnichannel Transformation and Logistics Architecture (2017–2026)
By 2017, the existential threat posed by Amazon’s logistical supremacy and the broader narrative of the “retail apocalypse” forced Target into an aggressive defensive posture. Recognizing that traditional brick-and-mortar strategies were insufficient, then-CEO Brian Cornell committed the company to a three-year, $7 billion capital expenditure program to overhaul its supply chain, remodel stores, and digitize its network.
The Acquisition of Shipt and Grand Junction
The centerpiece of this $7 billion strategic pivot was the rapid acquisition of last-mile delivery infrastructure. Rather than attempting to build massive, centralized e-commerce distribution centers to match Amazon, Target sought to utilize its existing network of nearly 2,000 stores. To optimize delivery routing software, Target acquired Grand Junction, a San Francisco-based transportation technology company, in late 2017.
Weeks later, in December 2017, Target executed one of the largest and most consequential acquisitions in its history, purchasing the same-day grocery delivery platform Shipt for $550 million in an all-cash transaction. This acquisition was transformative. Shipt’s model essentially digitized a retailer’s brick-and-mortar advantage by enlisting a gig-economy network of over 20,000 “shoppers” who physically walk the store aisles to pick out customer orders. Target teams worked at breakneck speed, uploading over 50,000 products to the Shipt app and rolling out the service to 57 stores within eight weeks, rapidly expanding the capability nationwide throughout 2018 and 2019.
The Mechanics of “Stores-as-Hubs”
This series of acquisitions birthed Target’s defining modern operational characteristic: the “Stores-as-Hubs” fulfillment strategy. Target successfully integrated its physical footprint with its digital platform, utilizing its real estate to serve dual purposes: traditional in-store shopping and localized digital order fulfillment. Target utilizes its network of nearly 2,000 retail stores as localized micro-fulfillment hubs. By picking digital orders directly from store inventory and routing them through localized sortation centers, the company minimizes expensive last-mile carrier fees and increases delivery density. The flow of goods moves from upstream distribution centers, to the retail store backrooms, into local sortation centers, and finally to the customer via Shipt or Target Last Mile Delivery drivers.
As of early 2026, a staggering 96% to 97% of all of Target’s digital sales volume is fulfilled directly by its physical stores. This model operates across multiple consumer touchpoints:
- In-Store Order Pickup (BOPIS): Customers purchase online and retrieve items at dedicated service counters.
- Drive Up: Curbside delivery executed by Target personnel, which has shown robust momentum and is highly popular for everyday essentials.
- Target Last Mile Delivery (TLMD) via Shipt: Same-day delivery direct to the consumer’s doorstep.
The unit economics of this localized model represent a massive competitive moat. Target’s internal calculations indicate that fulfilling an e-commerce order using its pre-existing store network allows the company to save approximately 40% per package compared to the exorbitant freight costs of shipping that same item from a dedicated, centralized distribution center.
Sortation Centers and Last-Mile Efficiency
To further optimize the “Stores-as-Hubs” model, relieve extreme congestion within store backrooms, and accelerate delivery speeds, Target introduced localized “Sortation Centers.” By 2024, Target’s supply chain facilities, including these sortation centers and traditional distribution centers, encompassed 68.5 million square feet of operational space.
In this hub-and-spoke logistics model, store employees pick and pack digital orders, which are then swept from the stores multiple times a day and transported to a local sortation center. At the sortation center, proprietary technology batches the orders by zip code and routes them to the lowest-cost carrier—whether that is a traditional third-party logistics provider or a Shipt driver utilizing TLMD.
This localized batching drastically increases delivery density (the number of packages dropped off per driver route), which is the primary driver of profitability in last-mile logistics. Target estimates that leveraging its TLMD capabilities through these sortation centers saves the company more than $30 million annually in last-mile delivery costs. Furthermore, it has allowed Target to continuously increase its fulfillment speed. In late 2025, Target delivered over 2 million more packages the next day than the prior year, with over 70% of digital orders fulfilled within a single day. As part of its 2026 strategic plan, Target intends to expand its next-day “brown box” delivery capabilities to an additional 20 metro areas.
Part IV: Macroeconomic Stress Tests and 2024–2025 Financial Performance
To accurately evaluate Target’s financial posture as of March 2026, it is imperative to analyze the severe macroeconomic pressures of the preceding 24 months and the subsequent recalibration of its business model.
The 2024 Earnings Nadir and Structural Headwinds
Following a period of unprecedented expansion during the 2020–2021 pandemic boom—where Target’s revenue crossed the $100 billion threshold for the first time in company history —the retailer faced acute structural and economic headwinds in 2024. A defining moment in this struggle occurred in May 2024, when a highly disappointing Q1 earnings report resulted in an 8% single-day decline in the company’s stock, erasing billions in market capitalization.
This downturn was driven by a confluence of negative variables:
- Discretionary Spending Pullback: Target’s revenue model is diversified across five core categories: Beauty & Household Essentials, Food & Beverage, Home Furnishings & Decor, Hardlines (electronics, toys), and Apparel & Accessories. Crucially, between 40% and 50% of Target’s sales are derived from discretionary categories. As inflation and elevated interest rates persisted, consumers became hyper-sensitive to price, prioritizing essential goods and pulling back on discretionary items. This dynamic hit Target significantly harder than staple-heavy rivals like Walmart.
- The Value Perception Gap: In a highly inflationary environment, Target struggled to maintain its “aspirational” identity while facing accusations of being overpriced compared to competitors. To combat this “value perception gap,” Target launched Dealworthy in 2024, a private-label brand featuring items priced primarily under $10, and implemented aggressive price cuts on 5,000 essential items in mid-2024 to attract price-sensitive consumers.
- Organized Retail Crime and Shrink: Inventory loss due to theft and organized retail crime became a severe crisis, peaking at a staggering $1.2 billion in 2023. This “shrink” acted as a massive drag on gross margins. Through increased security and inventory management protocols, Target managed to reduce this loss to roughly $500 million by 2025, though it remained a persistent challenge.
- Operational Friction of the Hub Model: While the “Stores-as-Hubs” program was highly efficient for freight costs, it generated friction at the store level. Relying on store aisles for e-commerce picking occasionally led to messy store environments, negatively impacting the walk-in guest experience and generating employee dissatisfaction. Rising labor wages for store workers also made high-touch services like Drive Up increasingly expensive to execute.
Fiscal 2025 Financial Results: Stabilization and Margin Resilience
Target’s full-year 2025 financial results, reported on March 3, 2026, reflect a company stabilizing its operations after executing a strict $2 billion efficiency program designed to protect the bottom line.
| Key Financial Metric | Full-Year 2025 | Full-Year 2024 | Year-over-Year Change |
| Net Sales | $104.8 Billion | $106.6 Billion | (1.7%) |
| Comparable Sales | – | – | (2.6%) |
| GAAP Earnings Per Share (EPS) | $8.13 | $8.86 | (8.2%) |
| Adjusted EPS | $7.57 | $8.86 | (14.5%) |
| Operating Income (GAAP) | $5.1 Billion | $5.6 Billion | (8.1%) |
| Operating Margin Rate (GAAP) | 4.9% | 5.2% | (30 bps) |
| Gross Margin Rate | 27.9% | 28.2% | (30 bps) |
| Effective Income Tax Rate | 22.3% | 22.2% | + 10 bps |
| After-Tax ROIC (Trailing 12M) | 13.8% | 15.4% | (160 bps) |
Data Source: Target Corporation Fourth Quarter and Full-Year 2025 Earnings Report.
While top-line net sales declined by 1.7% to $104.8 billion, driven primarily by a 2.6% drop in comparable sales, the underlying margin profile showed extreme resilience in the face of macro pressures. The gross margin rate contracted only slightly to 27.9%. This slight decline reflected pressures from higher promotional markdowns and purchase order cancellations required to clear inventory, but these negative factors were heavily offset by successful shrink reduction and rapid growth in the company’s advertising revenue. Notably, in the fourth quarter of 2025, sales and traffic trends accelerated, with Food & Beverage, Beauty, and Toys delivering net sales growth.
The Margin Subsidy: Roundel and Target Circle 360
A critical third-order insight regarding Target’s modern profitability is the structural transformation of its revenue mix. While traditional physical merchandising margins face persistent pressure from labor and supply chain costs, Target is aggressively monetizing its digital ecosystem. Revenue from non-merchandise sources grew by more than 25% in the fourth quarter of 2025.
This explosive growth is anchored by Roundel, Target’s proprietary retail media network. By selling highly targeted digital advertising space to its vendors on Target.com and within its app, Roundel acts as a pure-profit center. The advertising business delivered double-digit growth in Q4 2025, reaching nearly $2 billion in value, and is projected by analysts to scale to $4 billion by 2030.
Furthermore, membership revenue more than doubled year-over-year in Q4 2025, driven by the aggressive scaling of the paid Target Circle 360 delivery subscription program. Simultaneously, revenue from Target Plus, the company’s third-party digital marketplace, grew by over 30%. These high-margin alternative revenue streams act as a vital margin subsidy. They provide the financial cushion that allows Target to lower prices on physical items (like the Dealworthy brand) to drive foot traffic, without severely eroding consolidated operating income.
Part V: 2026 Strategic Recalibration: The Michael Fiddelke Era
The beginning of fiscal 2026 marked a pivotal transition in Target’s corporate leadership. On February 1, 2026, Michael Fiddelke—a 23-year company veteran and former Chief Financial Officer and Chief Operating Officer—officially succeeded Brian Cornell as Chief Executive Officer. While Cornell is widely credited with saving Target from obsolescence through his $7 billion digital investments in the mid-2010s, his final years were clouded by inventory miscalculations and the aforementioned sales slump.
The Philosophical Pivot: “Not an Everything Store”
Upon taking the helm, CEO Michael Fiddelke immediately announced a comprehensive, multi-year $6 billion turnaround strategy. During the March 2026 financial community meeting, Fiddelke boldly declared a fundamental philosophical pivot: “Target is not an everything store. That’s not what guests want from us”.
This represents a deliberate strategic retreat from attempting to compete head-on with Walmart and Amazon across infinite SKU availability. Instead, Target is returning to its roots, doubling down on “merchandising authority”—curated, culturally relevant assortments that win in style, design, and value. To reclaim its “Tarzhay” magic, the company is explicitly focusing its capital on three core categories: Home, Baby, and Beauty.
Capital Allocation and the $2 Billion Incremental Investment
To execute this vision, management committed to an incremental $2 billion investment in 2026. This massive capital deployment is evenly split between structural improvements and operational enhancements:
- $1 Billion Increase in Capital Expenditures (CapEx): Target plans to open more than 30 new stores in 2026 (including its 2,000th location in Fuquay-Varina, N.C.) and add more than 300 new stores by 2035. The CapEx will fund the largest store transformation in a decade, updating floor plans and visual displays across the chain. This includes building premium “Target Beauty Studios” in over 600 stores and launching premium baby boutiques featuring high-end partnerships with brands like UPPAbaby, Bugaboo, Doona, and Stokke.
- $1 Billion Incremental Operating Investments (OpEx): To fix the broken in-store experience that alienated customers in 2024, Target is deploying hundreds of millions of dollars into additional store payroll and comprehensive employee training. The goal is to ensure cleaner stores and more consistent guest service. Furthermore, the company is vastly increasing its spending on brand marketing and accelerating the integration of Artificial Intelligence (AI) to improve digital discovery and personalize the Target Circle loyalty program.
Consequently, management’s financial outlook for fiscal 2026 reflects cautious optimism. The company projects net sales growth in a range around 2% for 2026, driven by a small increase in comparable sales and the contribution of new stores. Target expects its full-year 2026 operating income margin rate to expand by approximately 20 basis points above the 4.6% adjusted rate seen in 2025, with GAAP and Adjusted EPS projected between $7.50 and $8.50. Early indicators suggest market approval, as Target stock surged over 7% following the announcement of this strategic plan.
Part VI: Exhaustive Dividend Analysis and Capital Stewardship
For institutional investors, pension funds, and income-focused retail portfolios, Target Corporation is fundamentally defined by its status as a Dividend Aristocrat. The company’s capital deployment philosophy is deeply entrenched in returning cash to shareholders through a progressively growing dividend and systematic, albeit flexible, share repurchases.
A Half-Century of Uninterrupted Dividend Growth
As of March 2026, Target Corporation boasts an exceptional, elite track record of increasing its annual dividend for 54 consecutive years. This streak indicates extreme cash flow durability, proving the company’s structural ability to maintain and grow cash distributions through multiple severe macroeconomic crises, including the 2008 Great Financial Crisis, the 2013 corporate data breach, the mid-2010s “retail apocalypse,” and the unprecedented volatility of the COVID-19 pandemic.
To contextualize the magnitude of this compounding growth, Target’s annual dividend payout was a mere $0.60 per share in 2008. Over the ensuing decade, the payout expanded exponentially, reaching $2.52 by 2018, jumping to $3.96 by 2022, and hitting an annualized rate of $4.44 in 2024.
In the fourth quarter of 2025, Target paid $516 million in dividends to shareholders (up from $513 million in Q4 2024), representing a quarterly payout of $1.14 per share. This establishes a forward annualized dividend of $4.56 per share for fiscal year 2026.
Yield, Growth Rates, and the Strategic Payout Ratio
As of early March 2026, Target’s stock provides a robust forward dividend yield fluctuating between 4.02% and 4.39%, highly dependent on daily share price volatility around the $115–$120 mark. This yield is highly competitive within the Consumer Defensive sector and significantly outpaces broader market averages.
However, a granular analysis reveals that the cadence of dividend growth has recently decelerated. Target’s historical compound annual growth rates (CAGR) highlight this shifting trajectory:
| Measurement Period | Average Annual Dividend Growth Rate |
| 10-Year Trailing Average | 7.82% |
| 5-Year Trailing Average | 11.09% |
| 3-Year Trailing Average | 5.98% |
| 1-Year Trailing Growth (2025 to 2026) | 1.81% |
Data Source: Target Corporation Historical Dividend Data.
This deceleration from double-digit growth during the pandemic to a sub-2% growth rate in 2026 is a highly deliberate strategic maneuver by Target’s Board of Directors. An analysis of the company’s dividend payout ratio provides the necessary financial context. Target currently operates with a payout ratio of approximately 54.48% to 54.8%. This metric indicates that the company is distributing just over half of its net earnings directly to shareholders as dividends.
While a payout ratio below 60% is generally considered highly secure—indicating that the dividend is safely covered by current earnings with a low risk of being cut or interrupted—distributing roughly 55% of earnings limits the absolute capital available for internal retention. Because CEO Michael Fiddelke’s aggressive turnaround plan requires a massive $2 billion incremental capital injection into stores, payroll, and AI technology in 2026, the Board has responsibly throttled the dividend growth rate to roughly 1.8% to preserve the necessary free cash flow for these vital capital expenditures. The dividend remains safely intact, but aggressive hikes have been temporarily sacrificed to fund the operational modernization required to drive future top-line growth.
Balance Sheet Strength and Share Repurchases
Beyond the dividend, Target historically generates substantial shareholder yield through equity repurchases. During the capital squeeze of Q4 2025, prioritizing balance sheet stability and dividend safety, the company elected not to repurchase any shares. However, the company maintains a massive arsenal of $8.3 billion in remaining capacity under the share repurchase program authorized by the Board of Directors in August 2021. This “dry powder” allows Target to act opportunistically to support its stock price during market downturns or aggressively reduce its outstanding share count once top-line sales growth and operating margins fully normalize.
From a balance sheet perspective, Target is conservatively levered and financially sound. The company maintains a Debt-to-Equity ratio of roughly 1.29, indicating a balanced, responsible approach to utilizing debt to finance assets without over-leveraging the equity base. Standard & Poor’s (S&P) Global Ratings recently assessed Target’s proposed senior unsecured notes with an ‘A’ rating, projecting that the company’s adjusted leverage will remain safely below 2.0x over the next two years. S&P analysts forecast that Target will generate solid operating cash flow capable of comfortably covering the projected $2.1 billion in aggregate annual dividend payments, alongside its necessary $4.5 billion to $5 billion in consolidated capital expenditures required for supply chain and technology initiatives. Furthermore, Target possesses excellent short-term liquidity, holding a $1.0 billion 364-day unsecured revolving credit facility set to expire in October 2025, alongside a $3.0 billion facility, ensuring ample operational runway.
Part VII: Corporate Sustainability, ESG, and Sociopolitical Dynamics
A contemporary analysis of Target’s corporate history and future viability is incomplete without evaluating its integration of Environmental, Social, and Governance (ESG) principles. Recognizing that long-term supply chain resilience, cost efficiency, and brand perception are inextricably linked to sustainability, the company launched its comprehensive “Target Forward” initiative in 2021.
The financial and operational commitments tied to Target Forward are substantial and require significant capital allocation. The company has formally pledged to become a net-zero enterprise by 2040, a goal that necessitates a vast overhaul of its logistics fleet, HVAC systems, and energy procurement strategies. Target achieved a major milestone toward this goal in 2022 by successfully launching its first net-zero energy store. Furthermore, the company launched “Target Zero” in 2022 to innovate product packaging and aggressively reduce waste across its vast assortment of owned and national brands. As the global ESG landscape recalibrates into 2026—moving away from pure public relations toward pragmatic, ROI-driven investments in energy security and infrastructure resilience—Target’s investments in modernization serve a dual purpose of cutting long-term utility costs while meeting regulatory expectations.
Socially, Target maintains deep, historical philanthropic roots. Since 1946, the company has adhered to a strict policy of committing 5% of its pre-tax profits back to local communities, resulting in millions of dollars in weekly charitable contributions through product donations, cash, and the Target Foundation. Recently, this social commitment included a 2021 pledge to spend more than $2 billion with Black-owned businesses by the end of 2025.
However, navigating the increasingly polarized American sociopolitical landscape has proven highly volatile for the brand. In the mid-2020s, the company faced significant cultural backlash and organized consumer boycotts regarding its merchandising decisions and vocal stances on various social issues. This external pressure, combined with internal financial challenges, led to a notable corporate retrenchment in diversity, equity, and inclusion (DEI) initiatives by 2025, aligning somewhat with broader governmental shifts during that period. This turbulence underscores the inherent, unique risk of mass-market brand positioning in a fragmented consumer economy, ultimately forcing Fiddelke’s management team to refocus the company’s narrative firmly on merchandise quality, aesthetic inspiration, and value delivery.
Conclusion
The history of Target Corporation is defined by an enduring capability to continuously mutate its operating model to survive, and often dictate, massive shifts in American consumer behavior. From its origins as a regional dry goods vendor in 1902, to the pioneering invention of the upscale discount format in 1962, to its modern iteration as a highly complex, omnichannel fulfillment engine, Target has consistently balanced merchandising ambition with logistical execution.
As the company progresses through fiscal 2026 under the leadership of CEO Michael Fiddelke, it faces a gauntlet of acute challenges: mitigating persistent organized retail shrink, defending market share against the relentless scale of Walmart and Amazon in an inflation-weary economy, and executing a risky $6 billion strategic pivot to reclaim its “Tarzhay” magic by admitting it cannot be an “everything store”.
Yet, the underlying financial architecture of the enterprise remains unshakeable. With $104.8 billion in trailing annual revenue, a rapidly growing, high-margin digital advertising business in Roundel, and a hyper-efficient localized fulfillment network that slashes delivery costs, the company’s cash-generation engine is structurally sound.
Ultimately, the most definitive, mathematical proof of Target’s corporate durability is its 54-year streak of dividend increases. Management’s current strategy—sacrificing short-term, aggressive dividend growth (holding at a modest 1.8% increase) to responsibly redirect $2 billion of free cash flow back into the physical stores and vital AI technological infrastructure—demonstrates a prudent, long-term stewardship of capital. For the institutional or income-focused investor, Target remains an archetype of corporate stability, utilizing its massive scale and evolving business model to ensure the continuous, uninterrupted return of capital to its shareholders, regardless of the macroeconomic weather.
So let us treat this as
D point twenty three Target TGT Tarzhay Through The Cycle
Month March
I will walk through it in the same narrative style as KO and TMO but tuned to a very different kind of animal a cyclical big box Dividend King instead of a lab tools compounder.
Executive summary Target as a high yield Dividend King under pressure
Target sits in a strange place right now.
On the one hand it is an elite income name. Target has raised its annual dividend for more than fifty consecutive years which qualifies it as a Dividend King. The latest increase of about one point eight percent announced in June twenty twenty five extends that streak and takes the quarterly dividend to one dollar and fourteen cents per share. On a full year run rate that is about four point five to four point six dollars per share in dividends. With the stock trading under one hundred dollars at points in twenty twenty five that translates to a five percent plus dividend yield. Dividend ratings outfits give Target very high marks for dividend safety and attractiveness and they are not doing that out of nostalgia.
On the other hand the business is coming off several rough years. After the pandemic surge in sales Target walked straight into a perfect storm. Wrong inventory buys in twenty twenty two led to massive markdowns and margin pain. Inflated shipping and supply costs hit hard. Consumers rotated away from discretionary categories into groceries and essentials. Culture war blowback did real damage to traffic and brand sentiment. Comparable sales fell three point seven percent in fiscal twenty twenty three and barely grew in fiscal twenty twenty four. The company is now throwing billions at store remodels price cuts and digital capabilities in an effort to revive the old Tarzhay magic.
Financially the picture is mixed but survivable. Net sales in fiscal twenty twenty four were about one hundred six point six billion dollars down a fraction from the prior year. Gross margin improved to twenty eight point two percent as freight and inventory issues eased but operating margin sat at about five point two percent versus eight point four percent only a few years earlier. Diluted earnings per share came in at eight point eight six dollars with cash dividends declared of four point four six dollars per share so the payout ratio sits a bit above fifty percent. Return on invested capital for the twelve months through the end of fiscal twenty twenty four was about fifteen point four percent. That is not doom at all. It is solid profitability from a battered retailer that still earns more than its cost of capital.
The market right now is treating Target as a damaged cyclical. The trailing price to earnings ratio around ten is far below the ten year average of roughly sixteen. The yield is unusually high relative to Target history and to large consumer names. This is exactly the kind of setup you care about for Dividend Centurions. You want resilient businesses with long dividend records that periodically go out of favor because the short term fundamentals look messy.
Here is the essence of the thesis for D point twenty three.
- Target is a unique mass merchant in the United States with about one thousand nine hundred eighty nine stores plus a fast growing digital business using stores as fulfillment hubs. More than seventy five percent of the United States population lives within ten miles of a Target.
- Its portfolio of more than forty exclusive owned brands generates over thirty billion dollars in sales which is nearly one third of total revenue. That is a real moat inside an otherwise brutal category.
- The company has a half century plus record of raising dividends through recessions inflation cycles and retail disruption. Even in the shock year twenty twenty two when earnings collapsed due to inventory mistakes they still raised the dividend.
- Near term the business is clearly in a repair phase with flat sales compressed margins image issues and leadership transition to a new chief executive from twenty twenty six. That is risk but it also sets up the possibility of a multi year earnings recovery.
- At a single digit to low double digit earnings multiple and a five percent plus yield Target is priced as if the Tarzhay era is permanently over. If they even partially restore traffic mix and margin the total return setup is attractive for a patient dividend investor.
In other words Target is not a straight line compounder like Thermo Fisher. It is a cyclical cash machine with a real brand and genuine execution scars. You are being paid in current yield to sit through the fix. The key question for a Dividend Centurions lens is simple.
Does Target have the staying power and culture to keep this dividend train running for decades more while gradually pushing earnings back toward its pre twenty twenty two profile
That is what we will unpack.
One Origin story and how Target became Tarzhay
To understand why Target still commands mindshare you have to go all the way back to old department store capitalism.
The company traces its roots to Goodfellow Dry Goods founded in nineteen zero two by George Dayton in Minneapolis. Over time the business became known as Dayton Dry Goods then the Dayton Company and grew into a major regional department store chain.
In the early nineteen sixties the Dayton family saw that the rise of discount retail was not a fad but an oncoming wave. They worked with executive John Geisse to create an upscale discount concept that combined department store quality with lower prices and self service. On May first nineteen sixty two the first Target store opened in Roseville Minnesota as the discount arm of the Dayton company.
The name was intentional. They wanted something distinct from the Dayton department store brand that still implied precision. A red bullseye was born and Target quickly grew to four Minnesota stores that first year. The concept lost money at first but by nineteen sixty five the stores were profitable enough to expand beyond Minnesota.
The corporate structure shuffled over the following decades. The Dayton company merged with Hudson to form Dayton Hudson in nineteen sixty nine and added chains like Marshall Field and Mervyns. Target remained the discount arm but its importance grew. In two thousand the parent company officially renamed itself Target Corporation signaling that the bullseye brand had become the core of the enterprise.
Through the nineteen nineties and two thousands Target carved out a space between Walmart and department stores. Shoppers nicknamed it Tarzhay a mock French pronunciation that reflected its mix of affordable prices and surprisingly stylish private labels. It was the place you could buy laundry detergent a Joanna Gaines candle and a decent throw pillow in the same run. That brand positioning was not an accident.
Target leaned heavily into design collaboration and owned brands instead of competing purely on price. Over time it built a portfolio of more than forty private label brands in categories like food apparel home and essentials. By twenty twenty five these owned brands generated more than thirty billion dollars in sales nearly one third of total revenue. Many of those brands such as Good and Gather for food and Cat and Jack for kids individually approach or exceed three billion dollars in sales.
At the same time Target invested heavily in stores and supply chain to keep up with e commerce. It bought same day delivery platform Shipt in twenty seventeen. It repositioned stores as hubs for digital fulfillment so that online orders could be picked up driven up or delivered from the nearest location rather than from distant warehouses.
By mid twenty twenties Target operated roughly one thousand nine hundred eighty nine stores in the United States supported by sixty six supply chain facilities and more than four hundred thousand team members. More than three quarters of the United States population lives within ten miles of a Target. Almost all stores offer free order pickup and drive up many offer Shipt delivery and same day coverage reaches more than eighty percent of the population.
So you end up with a retailer that is not just a row of red boxes along the highway. It is a dense physical network that doubles as a last mile distribution grid for a twenty billion dollar digital business. That physical digital hybrid is central to the investment case.
The last ten years have brought big tests. Dollar stores hollowed out low income traffic. Amazon rewired consumer expectations around convenience. Walmart leaned into its own omni channel model. Target has had phases where it out executed almost everyone and phases like twenty twenty two where it badly misjudged demand and paid for it.
Through all of that one thing did not break. The dividend.
Two Business model how Target actually makes its money
Target is a general merchandise retailer. That sounds boring until you remember it is quietly one of the biggest consumer funnels in the country.
Store network and guests
At the top level Target runs close to two thousand stores across all fifty states and the District of Columbia. Locations range from full size suburban boxes to smaller urban formats but the strategic model is the same. Stores act as both shopping destinations and mini fulfillment centers.
About seventy five percent of the United States population lives within a ten mile radius of a Target store. That physical proximity is a massive distribution advantage. It means order pickup drive up and ship from store can be extremely fast without building an entirely separate network of urban dark warehouses.
Besides stores Target operates sixty six supply chain facilities and twenty nine offices globally. So you have a three layer system. Import and vendor flow into supply chain centers. Those feed stores. Stores serve walk in guests and also act as forward fulfillment nodes.
Sales mix
Target does not report separate revenue segments the way some companies do. Instead it discusses merchandise mix by category in its annual report typically grouping sales into apparel and accessories beauty and household essentials food and beverage and home furnishings and decor.
Key points from the most recent five year summary.
- Net sales in fiscal twenty twenty four were about one hundred six point six billion dollars. That is slightly below twenty twenty three and twenty twenty two which were both a bit above one hundred seven and one hundred nine billion.
- Comparable sales were essentially flat in twenty twenty four up zero point one percent after a decline of three point seven percent in twenty twenty three and a rise of two point two percent in twenty twenty two.
- Over the cycle Target leans on food essentials and beauty for stability and on apparel home and hardlines for higher margin but more volatile growth. In fiscal twenty twenty four beauty delivered mid single digit comp growth while food apparel and essentials also grew comps modestly.
Broadly think of Target as a diversified basket. Groceries and essentials keep guests coming weekly. Apparel and home drive basket size when the consumer is feeling better. Beauty is a sweet spot Target has leaned into with strong own brands and partnerships.
Owned brands vs national brands
A critical aspect of the model is owned brands. Target has more than forty private label brands spanning food apparel home and essentials. These brands are not cheap knockoffs. They are designed products with real followings and often occupy the middle to premium part of the price ladder.
According to analysis by Yale School of Management Target owned brands generate more than thirty billion in annual sales nearly one third of the total business. Eleven of those brands individually generate over one billion in sales and four marquee labels Good and Gather Cat and Jack Up and Up and Threshold are each near or above three billion.
Owned brands matter because they carry better margins build differentiation that pure price competitors cannot easily copy and give Target control over design and supply chain. They also feed the Tarzhay image of affordable style. A shopper may come in for a national brand detergent but leave with house brand throw pillows and kids clothes.
Target blends owned brands with national labels and occasional designer collaborations to keep the assortment feeling fresh. That mix of familiar names plus exclusive items is part of its playbook for standing out in a crowded field.
Digital and stores as hubs
Target has spent the last decade pushing hard on omni channel. Rather than chasing Amazon with a warehouse heavy model it doubled down on using stores as the backbone of fulfillment.
The company now runs a first party digital business of roughly twenty billion dollars in annual sales. Same day services such as Drive Up and same day delivery with its Target Circle subscription grew at double digit rates in twenty twenty four.
Most digital orders are fulfilled from stores rather than from separate fulfillment centers. That reduces shipping distance and cost improves inventory utilization and gives guests multiple fulfillment options. Same day delivery through Shipt reaches more than eighty percent of the United States population and Target is now expanding next day parcel delivery coverage to more metro areas.
This stores as hubs model is capital intensive but strategically smart. Stores pull double duty as showrooms and mini warehouses and the capital already invested in real estate gets leveraged a second time. The more volume Target can funnel through stores the more its cost per order improves.
Ancillary businesses
Target also operates Shipt for same day delivery and Roundel which is its retail media network that sells advertising to brands. These add higher margin revenue streams layered on top of the core retail business. Retail media in particular is a quiet profit driver since brands pay to promote products on site and in app where purchase intent is strong.
So when you strip the story down Target makes money by combining three pillars.
One a huge national store network that sits physically close to most shoppers.
Two a set of strong owned brands plus national brands that create a Tarzhay experience rather than a plain stack it high world.
Three a digital layer that turns those stores into fulfillment nodes with retail media and delivery fees riding on top.
The result is a business that can produce massive revenue and healthy margins when execution is on point but which is also quite exposed to consumer sentiment inventory decisions and public perception.
Three Moat what protects Target in a brutal retail world
Compared with Thermo Fisher your moat here is narrower and more cyclical. But it is not zero. Target does have real competitive advantages that support long term cash flow and therefore the dividend.
Brand and Tarzhay identity
First and loudest is the brand. Almost everyone in the United States knows the bullseye. For a long time Tarzhay shorthand captured the idea that this was the store where you get affordable items that look nicer than a pure low price competitor.
The company itself leans into that language. In the twenty twenty four annual report Brian Cornell describes Target as occupying a unique space in United States retail delivering affordability style and newness at the intersection of product and experience. External coverage has noted Target is explicitly trying to revive that Tarzhay feel as part of a broader turnaround.
Brand by itself does not guarantee margins but it does drive choice. When a family decides where to do a weekly run their mental decision tree is not purely price per ounce. It includes store feel trust convenience habit and even little dopamine hits from nice merchandising. Target has lived in that space for decades and it is hard for a new entrant to replicate.
Owned brands and design capability
Owned brands are the second layer of moat. Most mass retailers have private labels but Target took this to a different level. More than forty owned brands generating over thirty billion dollars in sales with eleven of them above one billion each and several near or above three billion is not a casual project.
These brands are integrated with Target design culture in many cases created and iterated by an in house design organization that treats brand development like a core competency. They are not available elsewhere which means a customer who falls in love with Cat and Jack or Threshold has to come back to Target for that exact look and fit.
That is a real moat in categories like kids apparel and home goods where fashion quality and price all matter. Walmart can undercut on price in some items but matching design and lifestyle brand feel is harder.
Store network and proximity
The third moat element is the physical network. Almost two thousand stores and more than three quarters of the population within ten miles of one location is a serious logistical asset.
Walmart has even more stores and deeper grocery penetration so you cannot claim Target has a monopoly on proximity. But Target manages to place stores in many middle and upper income suburbs and urban neighborhoods where a shopper might not prefer a huge supercenter experience.
That network is also what underpins the stores as hubs model. Because stores are close to demand same day fulfillment becomes viable at scale. It would take billions and many years for a new competitor to replicate that grid.
Digital and fulfillment integration
Target uses those stores to handle most of its digitally originated orders which improves availability and delivery speed and trims last mile costs. Same day pickup drive up and Shipt delivery all rely on existing store inventory. When it works well this system is hard for pure online players to match on economics.
Competitors like Amazon and Walmart are not standing still of course. Amazon continues to expand same day capabilities and Walmart claims it can reach almost the entire population with next day or two day delivery. But Target does not need to beat them on every metric. It needs to offer a good enough convenience package combined with its own merchandise differentiation.
Switching costs and loyalty
Retail has very low formal switching costs. Shoppers can simply go elsewhere. But there are soft switching frictions. For a family that has built weekly routines around Target has store cards set up knows the layout and trusts the kids clothes sizing the path of least resistance is to stay unless something goes seriously wrong.
Loyalty programs like Target Circle and the new Target Circle subscription add a bit of stickiness by bundling free same day delivery and deals. Again this is not a Thermo Fisher level moat but layered together with the brand and owned labels it creates a meaningful connection.
What is not a moat
It is just as important to be blunt about what does not count as moat here.
- Target does not have unique technology that others cannot build.
- It does not have regulatory barriers protecting it from competitors in the way a utility or drug maker does.
- In groceries and commodity household essentials pricing is set by a very competitive market.
So this is a situation where moat depends on execution and perception. When Target hits on assortment price and experience the brand and network generate excellent returns on capital. When it misreads consumer appetite or stumbles into political fights a lot of that moat temporarily vanishes.
That means for a Dividend Centurions angle you cannot lazily assume Thermo Fisher like compounding. You have to look at the longer history of how Target navigates cycles.
Four Financial performance the real earnings power vs the recent mess
Let us walk the last five years with numbers.
Revenue and same store sales
From the five year summary in the twenty twenty four annual report.
- Net sales were about one hundred nine point one billion in fiscal twenty twenty two one hundred seven point four billion in fiscal twenty twenty three and one hundred six point six billion in fiscal twenty twenty four.
- Comparable sales growth was nineteen point three percent in fiscal twenty twenty twelve point seven percent in twenty twenty one two point two percent in twenty twenty two negative three point seven percent in twenty twenty three and plus zero point one percent in twenty twenty four.
So the pattern is clear. Massive pandemic boost then a comedown. Target over ordered discretionary stock just as shoppers shifted back toward services and away from things like televisions and home decor. They then had to blow that inventory out with heavy markdowns which pressured margins.
By fiscal twenty twenty four comps finally stabilized just above flat. That is not thrilling but it is a sign that the worst of the sales correction may be behind them. Within the mix beauty food and essentials are doing better while home and some hardlines still lag.
Margins
Gross margin as a percentage of net sales was twenty nine point three percent in twenty twenty and twenty twenty one then plunged to twenty four point six percent in twenty twenty two. It recovered to twenty seven point five percent in twenty twenty three and twenty eight point two percent in twenty twenty four.
Operating income margin followed a similar path. It peaked at eight point four percent in twenty twenty then fell to three point five percent in twenty twenty two before recovering to five point three percent and five point two percent in the last two years.
What this tells you.
The structural earnings power of Target in a normal demand environment is probably somewhere between five and eight percent operating margin. The twenty twenty and twenty twenty one numbers benefited from unusual demand and mix. The twenty twenty two number reflects a self inflicted wound. The current five percent area looks like a reasonable base from which they can try to grind higher through mix cost efficiency and digital scale.
Earnings per share
Basic earnings per share over the last five years were about eight point seven two in twenty twenty fourteen point two three in twenty twenty one six point zero two in twenty twenty two eight point nine six in twenty twenty three and eight point eight nine in twenty twenty four. Diluted EPS is nearly identical with eight point six four fourteen point one zero five point nine eight eight point nine four and eight point eight six respectively.
So even after the big hit in twenty twenty two earnings have recovered but not yet back to the peak. The trend since twenty twenty two is up though. That matters for dividend sustainability and for re rating potential.
Cash flow and investment
Operating cash flow in fiscal twenty twenty four was about seven point three seven billion dollars versus eight point six two billion in the prior year. Capital expenditures were about two point eight nine billion down from four point eight zero six billion in twenty twenty three and over five billion in twenty twenty two.
So Target has dialed back capex from the sprint years when it was heavily modernizing stores and supply chain. Two point nine billion is still a big number but it frees up more of that seven billion in cash flow for dividends and buybacks. Net sales per square foot sits in the low four hundreds which is healthy for a big box concept.
Return on invested capital
Target tracks ROIC in its earnings materials. For the twelve months through the end of fiscal twenty twenty four after tax ROIC was about fifteen point four percent which is a decline from sixteen point one percent in the prior period but still clearly above the company estimate of its cost of capital.
From a Dividend Centurions perspective this is key. You want a company that is not just limping along but actually earns a spread between ROIC and its cost of capital. That spread funds growth and makes dividend increases sustainable.
Even with all the noise Target is still generating mid teens ROIC. That suggests the underlying format is far from broken. What is broken right now is mood mix and maybe some trust.
Leverage
Total assets are about fifty seven point eight billion and net debt is around twelve point zero billion. That is a manageable leverage profile for a company with over one hundred billion in annual sales and multi billion annual cash flow.
So if you zoom out beyond the last two or three headlines the financial picture looks like this.
A giant retailer that had a nasty earnings air pocket in twenty twenty two but still runs a double digit ROIC has returned to mid single digit margins and generates enough cash each year to both invest and support a forward dividend payout in the fifty percent range.
That is not perfect. But it is a very solid base for a long running dividend story.
Five Dividend story why Target is already a Dividend King
This is where Target quietly looks world class.
Length of the streak
Dividend.com and Sure Dividend both place Target in Dividend King territory meaning fifty or more consecutive years of annual dividend increases. A June twenty twenty five press release from the company notes that with the latest increase Target is on track for its fifty fourth consecutive year of higher annual dividends and its two hundred thirty second consecutive dividend payment since going public in nineteen sixty seven.
The slight variation in streak counts between sources depends on whether you count calendar years or fiscal years and how you define annual increase but the main point is clear. Target has raised its dividend every year since the late nineteen sixties.
That means the dividend survived the stagflation seventies the double digit interest rates of the early eighties the dot com bust the global financial crisis the retail apocalypse narratives of the two thousand tens and the pandemic.
Current level and yield
As of late twenty twenty five the quarterly dividend is about one dollar and fourteen cents a share. That is about four point five to four point six dollars on an annualized basis. At share prices in the mid eighties to low nineties this equates to a yield around five percent.
For context the consumer defensive sector average yield is around three percent. Walmart yields roughly one and a half percent. Costco yields under one percent though it occasionally pays special dividends. So Target stands out as a frankly high yielding retail name.
Payout ratio and coverage
Fiscal twenty twenty four cash dividends declared were four point four six dollars per share versus diluted EPS of eight point eight six dollars. That is about a fifty percent payout ratio.
Third party data sets that track trailing payout ratios show a similar figure in the low fifties.
A fifty percent payout ratio is not super conservative like Thermo Fisher single digit payout. But for a mature large cap with steady cash flow it is reasonable. It means each year roughly half of earnings go to shareholders as cash and half remain inside for reinvestment debt service and buybacks.
On a free cash flow basis coverage looks a bit better because depreciation is a big non cash expense and capex has been pulled down from its peak. Target’s annual operating cash flow of more than seven billion and capex under three billion leave multiple billions per year for dividends and repurchases.
Growth rate
Dividend growth has slowed recently because earnings growth has been volatile. Over long stretches Target delivered very healthy dividend growth. For example cash dividends per share climbed from two dollars seventy in fiscal twenty nineteen to four point four six dollars in fiscal twenty twenty three which is roughly eleven percent compound annual growth over four years.
More recently the increase has been smaller. The twenty twenty five hike was about one point eight percent. That is the company being honest with itself. When earnings are not growing strongly you do not force big dividend hikes just for optics.
The important signal is that even in twenty twenty two when EPS dropped more than half versus twenty twenty one due to markdowns Target still raised the dividend modestly. They did not even flirt with a cut. That tells you how seriously management treats the streak.
How resilient has the dividend been in stress
Consider a few stress periods.
During the global financial crisis Target was under significant pressure particularly the credit card portfolio it owned at the time. Yet it held and then gradually grew its dividend later monetizing the card business through a partnership.
During the worst of the twenty twenty pandemic shock when stores had to adjust operations and there was real uncertainty about consumer demand Target actually benefited from stimulus and being considered essential retail. It raised the dividend twice between twenty twenty and twenty twenty two.
Then came twenty twenty two when operating margin fell from over eight percent to three point five percent. Earnings per share dropped from around fourteen dollars to about six dollars. Many retailers in that situation would freeze or cut dividends. Target raised.
This is not to say they are invincible. If management blew up the balance sheet or if some structural shift destroyed margins for years a fifty percent payout could become a problem. But historically Target has shown a strong bias to maintain and grow the dividend through thick and thin.
Takeaway for Dividend Centurions
Target already is what most companies in your series aspire to become. A half century plus of raises is literally the definition of a Dividend King.
The nuance is that future dividend growth here will not be a smooth mid teens line. It will ebb and flow with earnings cycles. Over a full cycle you might model something like mid single digit to high single digit dividend growth not Thermo style mid teens.
But given the starting yield near five percent and the demonstrated willingness to keep increases coming even in tough years Target has a very real claim to a permanent seat in a Dividend Centurions portfolio provided you can stomach retail volatility.
Six Risk landscape what can hurt this story
Unlike Thermo or Coke where the range of outcomes narrows nicely around secular growth Target lives in a far messier world. There are several genuine risk clusters you need to keep in view.
Category and macro cyclicality
Target sells a lot of discretionary goods such as apparel home decor and electronics. When consumer confidence drops or inflation squeezes budgets people trade down or delay those purchases.
The last few quarters show that in real time. Reuters coverage notes Target has had multiple quarters of declining or flat comparable sales as shoppers cut back on non essentials under inflation pressure. Some news outlets describe as many as ten consecutive quarters of flat or negative same store sales.
If the economy lingers in a weak patch or if higher interest costs and student loan payments keep pressuring budgets Target will feel it. Groceries and essentials cushion but do not fully offset weakness in high margin discretionary items.
Competition from Walmart Amazon and hard discounters
Walmart is an enormous competitive force. It beats Target on everyday low prices in many categories and has also built a strong omni channel offering with pickup and delivery that often matches or beats Targets reach.
Amazon remains the benchmark for convenience selection and membership value. Discount chains and dollar stores nibble at the low end. Warehouse clubs like Costco capture the value seeking middle income family.
Target’s differentiation through owned brands and experience is real but it is not unassailable. If the company stumbles on assortment or price for too long guests will shift share to competitors and it is hard to claw that back.
Execution missteps in inventory and assortment
Twenty twenty two was a sobering example. Target misread the post pandemic demand mix over ordered discretionary goods and then had to clear them with heavy markdowns. The result was a roughly three hundred basis point hit to gross margin and a plunge in operating profit.
Retail will always involve forecasts and bets. But if Target repeats that kind of mistake too often it will erode its balance sheet and investor trust.
There is also the risk of merchandise misses. In recent years some critics have argued that Targets assortment leaned too heavily into certain trendy aesthetics while neglecting core basics at sharp prices. It will take time to calibrate that.
Culture wars and brand perception
Target has found itself in the crossfire of cultural battles over the last couple of years. Shifts in Pride merchandise placement and changes to diversity initiatives triggered boycotts and counter boycotts. Some controversies were amplified by social media and political actors. Regardless of your personal view the investment point is simple this kind of noise can hurt traffic.
Reports suggest consumer backlash and confusion over Targets stance on inclusive merchandise have contributed to weaker sales and added to the complexity the new chief executive will have to manage.
For a Dividend Centurions investor this matters less at the level of any single quarter and more as a signal about management decision making and brand stewardship. You want evidence that the company learns quickly from misjudged moves and re focuses on clear consistent positioning.
Security issues and shrink
Shrink a polite term for theft and inventory loss has become a larger concern across retail. Target has cited higher shrink as one factor hurting profitability in recent years. Some stores in high theft markets have been closed or seen security measures ramp up.
If shrink continues to increase either because of organized retail crime or inadequate store practices gross margins could be pressured. Addressing shrink also costs money and may make the shopping experience less pleasant which can itself hurt sales.
Leadership transition
Brian Cornell has been widely credited with turning around Target in the middle of the last decade refocusing on core stores and pulling out of missteps such as the failed Canada entry. He will step down as chief executive on February first twenty twenty six and move to executive chair with Michael Fiddelke promoted to the chief executive role.
Fiddelke is a twenty year company veteran who has held finance and operations roles. Continuity can be good but some investors would prefer an outsider for a true reset.
The risk here is not that the new chief executive is incompetent. The risk is that the team is too close to existing strategy and underestimates how much change is needed to restore Tarzhay mojo. You will want to watch early decisions on merchandising pricing and store experience as signals.
Capital intensity and strategic spending
Target is planning to invest several billion dollars in the next few years on new stores remodels supply chain and technology. The company announced strategic plans to drive more than fifteen billion in incremental sales by twenty thirty funded by ongoing capital investments. News reports also reference multibillion spending on store revamps in twenty twenty six.
If those investments do not generate sufficient lift in sales and margins then capital efficiency will deteriorate. That would eventually pressure both ROIC and the ability to keep growing the dividend.
Summary of risk for the dividend
Combine all of this and you get a picture where the dividend is not fragile in the near term but the long term growth rate is very sensitive to retail execution.
In any given year the risk is not that Target suspends the dividend given its track record and current coverage. The more realistic risk is that dividend growth slows to token levels for stretches if earnings stagnate. Over a long horizon that still gets you a much larger payout but it is not a straight line.
For Dividend Centurions you accept some of this volatility because the starting yield is high and the company history suggests it can work through retail cycles. The main bet you are making is that Target will not permanently lose relevance in American retail.
Seven Valuation what the market is pricing in
Right now the market is pretty pessimistic about Target.
Simple multiples
Trailing price to earnings sits around ten well below the ten year average near sixteen and the median around fifteen.
Free cash flow yield is meaningfully higher than in the years when Target was a market darling. The dividend yield at five percent plus is near the top of its historical range.
By comparison Walmart trades at a much richer earnings multiple and a much lower yield. Costco is even more expensive. On a simple relative basis Target looks cheap.
Base case
In a base case you assume Target gradually repairs traffic mix and margin over the next few years without magic. Suppose sales grow in the low single digits say two to three percent per year from a hundred six billion baseline. Suppose operating margin improves from about five percent toward six percent as supply chain investments and mix help.
That kind of path could get you to mid single digit earnings per share growth over time maybe in the three to seven percent range. Layer on a share count that drifts down a bit each year from buybacks and you might reach something like five to eight percent EPS growth through a cycle.
If the market is willing to value that at a price to earnings multiple of say twelve to fourteen in a normalized environment you get some multiple expansion from today. Combine say six percent earnings growth with modest re rating and a five percent starting yield and your expected total return might live in the low teens per year over a long horizon.
Bull case
In a more optimistic scenario Target nails its assortment revives Tarzhay energy and fully leverages its store hubs and digital. Sales growth could move up toward three to four percent annually as they open more stores and grow digital share. Owned brands keep grabbing mix which is margin accretive. Shrink stabilizes or improves.
Under that story operating margin might move back toward seven or even eight percent which would put EPS growth in the high single digit to low double digit range. If investors start to believe Target is back in a durable growth groove again the multiple could mean revert toward the historical mid teens or higher.
Now you are talking about maybe ten percent plus EPS growth plus a five percent yield plus some multiple move. Over a decade that is extremely powerful.
Bear case
In the bear scenario Target flails. Comps stay flat or negative for years. New store and remodel investment does not pay off and instead becomes an anchor. Culture wars continue to alienate part of the customer base. Walmart and Amazon widen their advantage on price and convenience.
Earnings in that world could grind sideways or even decline slowly. The board may still cling to the dividend streak but payout ratio would creep up if they insist on increases without EPS growth. Eventually that could force them to flatten the dividend and in an extreme worst case scenario consider a cut.
Valuation in that world might remain stuck around eight to ten times depressed earnings and the stock would likely lag badly. The yield might climb but because of price decline not dividend growth. You would still collect cash but total return could be poor.
Where are we now
Looking at the numbers the current valuation seems to price in something closer to a mild bear than to the base case. A single digit price to earnings multiple usually appears when a business is either highly cyclical or in structural trouble. Target is definitely cyclical but the evidence does not yet scream structural decline.
ROIC remains mid teens. The company is still generating multi billion cash flow and reinvesting with some discipline. It still has a giant physical and brand footprint. So unless you believe that Walmart Amazon and political backlash will permanently reduce its earning power the current price probably bakes in a lot of the bad news.
Your job as a Dividend Centurions architect is to ask whether you are comfortable underwriting the base case with a margin of safety. Right now you are being paid five percent per year in cash to wait while you find out.
Eight Capital allocation how Target uses its cash
Target has a fairly straightforward capital allocation framework.
Investment in stores and capacity
First priority is investing in the business. Over the last several years capex has consistently been in the two point five to five point five billion dollar range per year. That money goes toward new stores remodels store format experiments supply chain facilities automation technology and digital capabilities.
In twenty twenty four capex dipped below three billion as they completed some waves of heavy investment. The company has announced plans to open about twenty new stores per year in the near term and remodel many more. They also plan to add hundreds of larger format stores over the coming decade that act as even more powerful hubs for e commerce.
Strategically this is necessary. To maintain Tarzhay appeal you have to keep stores fresh layouts modern and supply chain efficient. The risk as noted earlier is that they over invest relative to the sales response.
Dividend payments
Second they fund the dividend. In fiscal twenty twenty four Target paid about four point four six dollars per share in dividends which equated to around two point zero billion dollars total cash paid to shareholders. In the fourth quarter alone they paid five hundred thirteen million in dividends.
The board has been very reluctant to touch this stream except to raise it. That discipline is part of why independent analysts give Target high dividend safety scores.
Share repurchases
Third they repurchase shares when they see value and have capacity. In the fourth quarter of fiscal twenty twenty four they repurchased about three point seven million shares at an average price of one hundred thirty six dollars and eighty cents totaling roughly five hundred six million dollars. As of that time about eight point seven billion dollars remained on the existing repurchase authorization.
Over the last five years share count has gradually ticked down from around five hundred million to mid four hundreds. This gives a modest lift to EPS over time.
Balance sheet and ROIC focus
Target explicitly tracks ROIC and emphasizes that metric in investor communication noting fifteen point four percent for the trailing twelve months to fiscal twenty twenty four. That focus acts as a guardrail. Management can champion big initiatives but if they consistently drive ROIC down investors will have a clear yardstick.
Net debt levels are moderate relative to cash flow and asset base. There is no sign the company is levering up recklessly.
From a Dividend Centurions perspective this capital allocation pattern is one you like. They are eager to invest but also eager to keep the dividend streak alive and to retire shares when conditions allow. They are not empire building for its own sake.
Nine Peer context where Target sits vs Walmart and Costco
Within your broader portfolio you will likely compare Target to other large retail centurions.
Walmart
Walmart is the giant. It has more stores deeper grocery penetration and a more everyday low price model. It also has a more defensive earnings profile because groceries dominate. Walmart’s dividend record is long and it has raised the dividend for decades as well though growth has been modest in recent years. Yield is only around one and a half percent.
Walmart’s valuation is more demanding. Investors pay up for its scale and stability. If you view Target as a recovery story it can offer higher yield and more upside at the cost of more volatility.
Costco
Costco is the gold standard for member love and pricing trust. Its membership fee model provides high margin revenue and locks in loyalty. It has a long history of dividend increases plus occasional large special dividends. The regular yield is low but total shareholder income is high when you include special payouts.
Costco trades at a very high multiple because investors see it almost as a consumer staple with strong growth. From a Dividend Centurions point of view you might pair Costco with Target to balance quality and yield.
Dollar stores and discounters
Dollar General Dollar Tree hard discount grocers and various regional chains compete at the low price small basket end. Many of these businesses are under pressure as low income consumers get squeezed and as theft and labor costs rise. They tend to have much smaller dividends or none at all.
What makes Target distinct
Target’s combination of Tarzhay brand owned labels and omni channel stores as hubs puts it in a somewhat separate niche. It is not as price relentless as Walmart nor as membership anchored as Costco. Instead it offers a curated experience leaning on in house design.
For dividend investors that means Target offers a much higher yield than Walmart or Costco today but you have to accept higher earnings volatility and more brand risk.
If you think of your Dividend Centurions series as a baseball lineup Walmart might be the steady lead off hitter who always gets on base Costco the cleanup slugger with occasional huge home runs via special dividends and Target the somewhat streaky middle order bat that can put up big numbers in a good season and slump in a bad one.
Ten Future outlook what Target could look like in ten to twenty years
Now zoom out beyond the current noise and imagine a March D point thirty something entry where you look back at this D point twenty three Target write up.
Scenario one successful Tarzhay renewal
In this future Target’s current investments pay off. Store remodels make locations feel bright and curated again. Owned brands continue to expand and stay on trend. Digital experiences through app and web feel frictionless and order pickup or drive up is smooth.
The chain successfully navigates culture issues by being clear about who it serves and consistent in its merchandising stance reducing boycotts and controversy. Security and shrink are addressed through smarter design technology and staffing without ruining the guest experience.
Financially sales are growing in the low to mid single digits operating margin sits somewhere in the six to seven percent range and ROIC remains firmly above cost of capital. Earnings per share grow in the high single digits. As confidence rebuilds the market multiple edges back toward historical averages.
In that world Target continues to raise the dividend every year perhaps at five to eight percent annual pace. The yield might settle into the three to four percent range as the stock price recovers. Long term investors who bought during the twenty twenty four twenty twenty five slump would see very attractive total returns.
Scenario two muddle through
Here Target manages to keep its head above water but never fully regains Tarzhay glow. Sales bump around zero to low single digit growth margins stay in the four to five percent range as promotional pressure and theft offset efficiency gains.
The company still generates enough profit to maintain and slowly grow the dividend but payout ratio creeps from fifty percent toward sixty or seventy percent. Buybacks become sporadic. The stock trades at a cheap but not distressed multiple and the main attraction is a high but slow growing yield.
This path still works for some income focused investors but it is not the Centurion ideal. The dividend would grow but not strongly enough to outpace inflation by much and capital appreciation would be limited.
Scenario three structural decline
In the nightmare scenario Target never really solves its assortment pricing and brand issues. Younger shoppers drift permanently to competitors. Culture war blowback continues to flare up. Stores begin to feel stale compared with rivals that better evolve.
Margins compress toward low single digits and stay there. ROIC slips toward cost of capital. To preserve the streak management keeps raising the dividend a little each year even as earnings stagnate driving payout ratio into uncomfortable territory. Eventually they are forced to freeze or even cut the dividend in order to shore up the balance sheet.
I think this scenario is possible but not the base case. The assets and capabilities Target has built are too meaningful to dismiss. That said you cannot rule it out. Retail history is full of former champions that lost relevance.
What actually matters for you
For a Dividend Centurions series the main judgement is whether Target belongs in the core long horizon bucket or in a separate watchlist of higher risk higher yield plays.
My view from the numbers and history.
- The probability that Target is still operating meaningful stores ten and twenty years from now is very high.
- The probability that it will still be paying a dividend in those years is also high given the fifty year history and current balance sheet.
- The probability that the dividend will keep growing every single year is good but not unimpeachable. It will depend on whether management can arrest the last few years slide in brand energy and put the omni channel model back on offense.
If you believe management can execute the Tarzhay renewal strategy they have laid out then today’s valuation looks like an attractive entry point into a long running Dividend King that the market currently dislikes.
Eleven Closing synthesis does Target deserve a Dividend Centurion slot
Time to answer your actual question in plain language.
Target is not a pristine compounding machine like Thermo Fisher or an ultra predictable consumer staple like Coke. It is a messy very human retailer that occasionally faceplants then scrambles back to its feet.
Yet over half a century it has always managed to keep writing bigger dividend checks. Through multiple economic regimes through the rise of Walmart through the birth of e commerce your dividend from Target has marched higher. That is exactly the kind of long term behavior you are screening for in Dividend Centurions.
Right now you are being offered that fifty plus year streak at a five percent yield because the market is understandably frustrated with recent execution and nervous about the near term outlook. Earnings are not broken. ROIC is still respectable. The store and digital infrastructure is massive.
So my candid view.
- As a business Target sits in a more fragile competitive position than your pure wide moat giants. Retail is unforgiving and you should expect more volatility.
- As a dividend vehicle Target is already a Centurion in spirit and in fact. The streak is real. The coverage is adequate. The culture around the dividend appears strong.
- At current valuation the risk reward for a patient dividend investor looks favorable provided you size it as a cyclical not as a forever perfect core like TMO.
For your series I would absolutely file this as
D point twenty three Target TGT Tarzhay Through The Cycle March
The angle I would emphasize for your readers.
Target is a case study in what a Dividend Centurion looks like when it lives in a rough neighborhood. The dividend itself is extremely durable. The business underneath it will have very good and very bad years. If you can live with that the combination of current yield and potential recovery makes it a compelling high yield chapter in the Dividend Centurions project by you ZachGPT.
