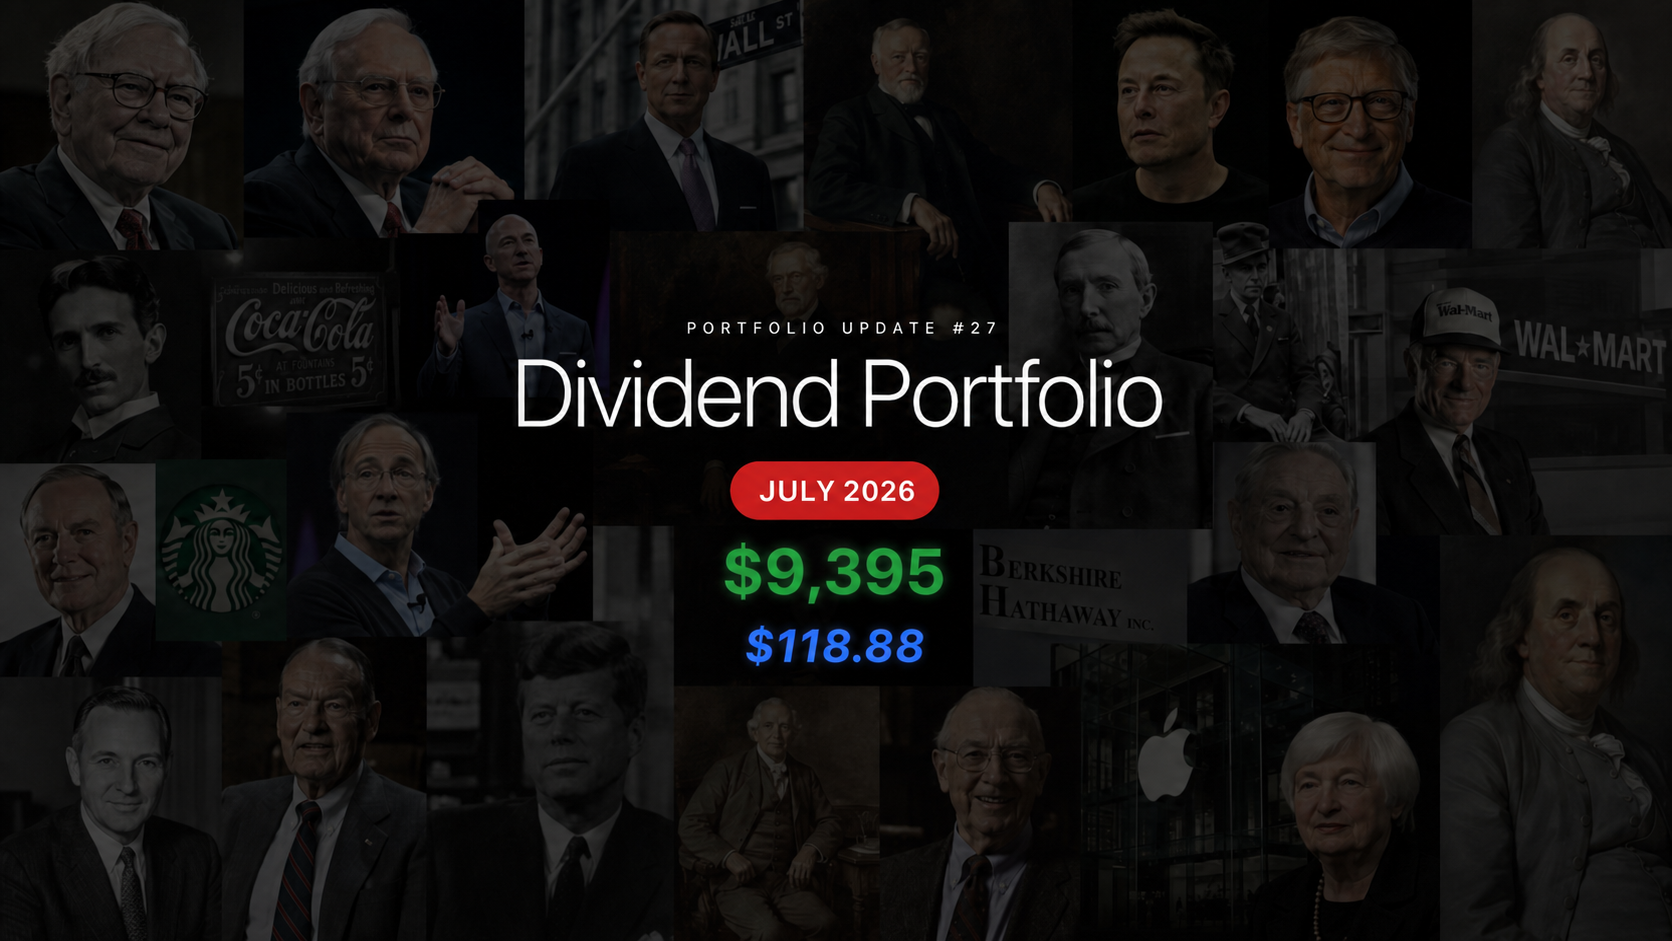

Historical reconstruction dated July 10, 2026
Reconstruction note: This update was rebuilt after the fact because the original July 10 brokerage capture was not preserved. The June 17 share counts and cost basis come from the published June review, and the July 10 closing prices are historical market data. Purchases after June 17 are estimated from the account’s established pattern: $1 invested in every dividend-paying position on each market day, no recurring purchase in Waters, automatic dividend reinvestment, and a new Carlisle starter after the July 9 D.27 feature. The reconstruction also accounts for S&P Global’s July 1 spin-off of Mobility Global, including the distribution rights attached to ordinary SPGI purchases through June 30. The totals below are a best estimate, not a replacement for the original brokerage statement.
July 2026
The portfolio has crossed $9,000.
At the July 10, 2026 close, the reconstructed account value is approximately $9,394.59, up from $8,554.88 in the June update. That is a headline increase of $839.71, or 9.8%.
This time, the increase can be separated more honestly. Approximately $392 came from recurring contributions, about $6.62 came from dividends paid and reinvested, and roughly $441.09 came from changes in market and corporate-action value. After removing external contributions, the account produced an estimated investment gain of $447.71, or about 5.1% using a contribution-adjusted calculation.
The distinction matters. Depositing money grows the account, but it is not investment performance. Dividends and market appreciation are.
The objective remains unchanged: accumulate ownership in quality businesses, reinvest the income, and allow both the companies and the share count to compound over time.
Portfolio Snapshot
| Metric | July 10, 2026 estimate |
|---|---|
| Net Portfolio Value | $9,394.59 |
| Stock Market Value | $9,397.14 |
| Assumed Cash Balance | −$2.55 |
| Invested Capital / Cost Basis | $7,521.16 |
| Total Unrealized Gain | +$1,875.98 (+24.9%) |
| Holdings | 29 |
| Previous Update | $8,554.88 |
| Change Since Previous Update | +$839.71 (+9.8%) |
| Estimated External Contributions | $392.00 |
| Estimated Dividends Reinvested | $6.62 |
| Contribution-Adjusted Investment Gain | +$447.71 (about +5.1%) |
| Forward Annual Dividend Income | $118.88 |
| Average Monthly Dividend Income | $9.91 |
| Forward Portfolio Yield | 1.27% |
| Forward Yield on Cost | 1.58% |
| Largest Position | Dell — $1,557.49 |
| Largest Position Weight | 16.6% |
Crossing $9,000 — With Better Attribution
The portfolio moved from $8,554.88 to approximately $9,394.59 in a little more than three weeks.
Here is the estimated bridge:
| Source of change | Amount | Share of total increase |
|---|---|---|
| Recurring external contributions | $392.00 | 46.7% |
| Dividends paid and reinvested | $6.62 | 0.8% |
| Market-price and corporate-action effect | $441.09 | 52.5% |
| Total change | $839.71 | 100.0% |
That is a healthier result than simply saying the account rose 9.8%. Just over half of the increase came from the investments themselves, while just under half came from new money.
The account is still in accumulation mode, so contributions will continue to matter. The goal is not to minimize them. The goal is to report them separately enough that progress is not confused with performance.
What Drove the Improvement
The strongest change came from Home Federal Bank of Louisiana. Its unrealized gain increased from about $191.12 in June to approximately $274.97 on July 10. Meta made the next-largest improvement, moving from an unrealized loss to a small gain.
| Holding | June unrealized result | July 10 estimate | Improvement / decline |
|---|---|---|---|
| Home Federal Bank of Louisiana | +$191.12 | +$274.97 | +$83.85 |
| Meta Platforms | −$59.91 | +$5.21 | +$65.12 |
| Apple | +$153.79 | +$195.97 | +$42.18 |
| Automatic Data Processing | −$40.10 | −$13.80 | +$26.30 |
| Waste Management | −$11.21 | +$14.78 | +$25.99 |
| S&P Global + Mobility Global | −$18.06 | +$2.55 | +$20.61 |
| Costco | −$5.83 | −$31.57 | −$25.74 |
| Alphabet | +$264.97 | +$250.17 | −$14.80 |
These are changes in each position’s unrealized result after including the estimated new purchases. They are not pure stock-price returns, but they show where the portfolio’s economics improved or weakened.
Costco and Alphabet were the main counterweights. S&P Global and Mobility Global must be evaluated together for this comparison: the decline in SPGI’s standalone price on July 1 was the mechanical result of separating a business, not the destruction of the same amount of portfolio value. Neither short-term move changes an investment case by itself. A few weeks of price action should not carry more weight than earnings power, competitive position, or the quality of management’s capital allocation.
Concentration Is Moving in the Right Direction
Dell remains the largest position, but its estimated weight declined from 17.8% in June to 16.6% in July even as its value increased.
That is the recurring-investment system doing useful work. New money is being spread across the dividend-paying holdings rather than directed into the largest winner, allowing the rest of the portfolio to catch up gradually without requiring a sale.
The five largest positions now account for approximately 45.3% of stock value, down from 47.6% in June:
| Holding | Estimated value | Portfolio weight |
|---|---|---|
| Dell | $1,557.49 | 16.6% |
| Home Federal Bank of Louisiana | $829.20 | 8.8% |
| Apple | $736.67 | 7.8% |
| Alphabet | $657.64 | 7.0% |
| Costco | $476.36 | 5.1% |
Dell still contributes about 58.0% of total net unrealized appreciation. That is down meaningfully from roughly 74% in June, but it remains the defining economic position in the account.
Twenty-nine holdings provide diversification by count. Position weights and sources of return determine whether that diversification is real.
Corporate Action: S&P Global Spins Off Mobility Global
The portfolio received a new holding on July 1 without making a new contribution.
S&P Global completed the separation of its Mobility division into Mobility Global, which began regular trading under the ticker MBGL. Shareholders received one MBGL share for each SPGI share carrying the distribution entitlement.
The recurring-purchase detail matters here. Ordinary SPGI shares bought through June 30 traded with the right to receive MBGL, so the eight modeled $1 SPGI purchases between June 18 and June 30 increased both the SPGI position and the eventual MBGL distribution. SPGI purchases beginning July 1 added SPGI only.
Robinhood’s corporate-action notice said fractional shares from this spin-off would be retained. The reconstructed account therefore receives approximately 0.6128 MBGL shares rather than cash in lieu.
| Metric | S&P Global | Mobility Global | Combined |
|---|---|---|---|
| Estimated Shares | 0.6289 | 0.6128 | — |
| July 10 Closing Price | $430.50 | $20.80 | — |
| Estimated Value | $270.73 | $12.75 | $283.48 |
| Allocated Cost Basis | $267.67 | $13.26 | $280.93 |
| Unrealized Result | +$3.06 | −$0.51 | +$2.55 |
The spin-off does not create investment income and it does not increase total cost basis. It divides the economics of the original investment between two securities. Using S&P Global’s published tax-basis method, 95.16% of the eligible pre-spin basis remains with SPGI and 4.84% moves to MBGL.
Mobility Global becomes the portfolio’s 28th holding. It had not declared a dividend by July 10, so it joins Waters on the non-dividend, developing side of the account unless the position is later sold or given a different role.
New Starter Position: Carlisle Companies
Carlisle Companies is the likely 29th holding.
The D.27 Carlisle report was published on July 9. Following the same pattern used for PayPal and Roper Technologies, the reconstruction assumes a $1 purchase on July 9 and another $1 purchase on July 10.
| Metric | Carlisle Companies estimate |
|---|---|
| Shares | 0.0061 |
| Cost Basis | $2.00 |
| July 10 Closing Price | $330.09 |
| Position Value | $2.00 |
| Forward Annual Dividend | About $0.03 |
At this size, Carlisle is a marker rather than a meaningful allocation. It gives the company a place inside the portfolio and allows the recurring system to build the position gradually.
The attraction is not current yield alone. Carlisle combines a long dividend-growth record with strong building-products franchises, recurring re-roofing demand, disciplined buybacks, and a history of improving the quality of its business portfolio.
The question is not whether the first $2 produces an immediate return. The question is whether Carlisle deserves a larger role over the next several years.
Dividend Income Recalculated
The June review deliberately left out an updated forward-income estimate because the brokerage capture did not show one. Rebuilding the figure from the June share counts and the declared dividend rates produces a comparable June baseline of approximately $112.47 per year.
Using the estimated July 10 share counts, forward annual income rises to approximately $118.88, or $9.91 per month.
That is an estimated increase of $6.41, or 5.7%, since the June snapshot on a consistent calculation basis.
| Metric | Recalculated June | July 10 estimate |
|---|---|---|
| Forward Annual Income | $112.47 | $118.88 |
| Monthly Average | $9.37 | $9.91 |
| Forward Yield on Market Value | 1.31% | 1.27% |
| Forward Yield on Cost | 1.58% | 1.58% |
The slight decline in current yield is not a negative by itself. Market value rose faster than projected income during the period. The more important figure is that the annual income capacity increased while the underlying capital also appreciated.
The July income stream remains concentrated, but less so than earlier estimates suggested:
| Position | Estimated annual dividends | Share of total |
|---|---|---|
| Home Federal Bank of Louisiana | $20.35 | 17.1% |
| Starbucks | $9.77 | 8.2% |
| Dell | $9.02 | 7.6% |
| Automatic Data Processing | $7.98 | 6.7% |
| FS Bancorp | $7.88 | 6.6% |
| Becton Dickinson | $7.68 | 6.5% |
| American States Water | $6.25 | 5.3% |
| Hamilton Beach | $6.07 | 5.1% |
| Waste Management | $5.74 | 4.8% |
| All other positions | $38.14 | 32.1% |
| Total | $118.88 | 100.0% |
HFBL remains the largest individual income source, but its estimated share is now about 17%, while the top three positions produce approximately 33% of forward income.
Dividends Put Back to Work
The following payments are estimated to have arrived and been reinvested between the June 17 snapshot and July 10:
| Company | Payment date | Estimated amount |
|---|---|---|
| Waste Management | June 18 | $0.93 |
| UnitedHealth | June 23 | $0.94 |
| Meta Platforms | June 25 | $0.35 |
| PayPal | June 25 | $0.05 |
| Becton Dickinson | June 30 | $1.76 |
| Coca-Cola | July 1 | $0.74 |
| Automatic Data Processing | July 1 | $1.85 |
| Total | $6.62 |
The WM, PayPal, Becton Dickinson, Coca-Cola, and ADP amounts come from payments displayed in the earlier account updates. UnitedHealth and Meta are reconstructed from the likely record-date share counts, so the true total could differ by one or two cents.
The amount is still small, but the mechanism is exactly what the portfolio is designed to create. Cash arrived from waste services, healthcare, technology, payments, medical devices, consumer staples, and payroll infrastructure, then purchased additional fractional ownership.
No single payment changes the account. Repetition does.
Pending on July 10
Four additional payments had been earned or were already displayed as pending by the July 10 close:
| Company | Estimated amount | Payment date |
|---|---|---|
| Thermo Fisher Scientific | $0.08 | July 15 |
| Intuit | $0.51 | July 17 |
| Roper Technologies | $0.05 | July 22 |
| Mastercard | $0.60 | August 7 |
| Total Pending | $1.24 |
These amounts are not included in the $6.62 already received and reinvested. They represent the next layer of cash scheduled to enter the account after the snapshot.
Going Into August
Four areas deserve attention.
-
Preserve contribution-adjusted reporting. The raw account balance is useful, but separating deposits, dividends, and market movement produces a more honest scoreboard.
-
Keep reducing accidental concentration. Dell remains the largest position and the largest source of historical gains. Broad recurring purchases are gradually lowering that dependence without forcing a sale.
-
Give the starter positions time to earn capital. Carlisle, Roper, and PayPal are still economically small. Their future size should depend on business quality and valuation, not merely on the fact that they are new.
-
Cross $120 in forward annual income. The reconstructed figure is only about $1.12 short. That milestone should arrive through the same combination of recurring purchases, reinvested dividends, and future dividend increases.
At the current recurring pace, the portfolio is also within reach of $10,000. The market will determine the timing, but the process does not need to change to get there.
July Takeaway
The reconstructed portfolio crossed $9,000 and finished July 10 at approximately $9,394.59.
It now contains an estimated 29 holdings, carries about $1,875.98 in net unrealized appreciation, and is projected to produce roughly $118.88 in annual dividend income.
The strongest part of the month was not the milestone itself. It was the composition of the progress. Approximately $392 came from new contributions, while about $448 came from dividends and market performance. The account grew because the savings process continued and because the existing capital worked.
Dell remains the portfolio’s defining winner, but concentration declined. Meta returned to positive territory. Home Federal Bank of Louisiana strengthened. Mobility Global arrived through the S&P Global separation, and Carlisle entered as a new starter. Forward income moved closer to $120.
The next numerical milestone is $10,000.
The more meaningful objective is to reach it with a portfolio that is more balanced, produces more income, and remains built around businesses worth owning for years rather than weeks.
Full Portfolio Snapshot
| Holding | Ticker | Estimated shares | July 10 close | Estimated value | Unrealized gain / loss |
|---|---|---|---|---|---|
| Dell | DELL | 3.5807 | $434.97 | $1,557.49 | +$1,088.08 |
| Home Federal Bank of Louisiana | HFBL | 37.6911 | $22.00 | $829.20 | +$274.97 |
| Apple | AAPL | 2.3363 | $315.32 | $736.67 | +$195.97 |
| Alphabet Class A | GOOGL | 1.8412 | $357.18 | $657.64 | +$250.17 |
| Costco | COST | 0.5199 | $916.25 | $476.36 | −$31.57 |
| Meta Platforms | META | 0.6883 | $669.21 | $460.62 | +$5.21 |
| Microsoft | MSFT | 1.1778 | $385.10 | $453.57 | −$77.38 |
| Starbucks | SBUX | 3.9393 | $106.01 | $417.60 | +$60.11 |
| Visa | V | 1.1919 | $348.97 | $415.93 | +$9.53 |
| Mastercard | MA | 0.6974 | $526.74 | $367.35 | −$15.82 |
| Waste Management | WM | 1.5179 | $233.33 | $354.17 | +$14.78 |
| FS Bancorp | FSBW | 6.7899 | $43.13 | $292.85 | +$15.76 |
| Automatic Data Processing | ADP | 1.1732 | $241.92 | $283.82 | −$13.80 |
| Becton Dickinson | BDX | 1.8290 | $151.94 | $277.90 | +$4.79 |
| S&P Global | SPGI | 0.6289 | $430.50 | $270.73 | +$3.06 |
| American States Water | AWR | 3.1023 | $84.51 | $262.17 | +$29.43 |
| Hamilton Beach | HBB | 12.1452 | $21.40 | $259.91 | +$48.54 |
| UnitedHealth | UNH | 0.4451 | $424.62 | $189.01 | +$41.64 |
| Cintas | CTAS | 0.9112 | $179.64 | $163.68 | −$2.79 |
| Coca-Cola | KO | 1.6183 | $83.49 | $135.11 | +$9.07 |
| Intuit | INTU | 0.4281 | $274.96 | $117.72 | −$70.67 |
| Thermo Fisher Scientific | TMO | 0.2149 | $527.05 | $113.24 | +$8.22 |
| Target | TGT | 0.6909 | $135.14 | $93.37 | +$6.93 |
| Johnson & Johnson | JNJ | 0.2737 | $256.98 | $70.34 | +$6.15 |
| Waters | WAT | 0.1550 | $376.43 | $58.35 | +$12.57 |
| PayPal | PYPL | 0.9626 | $46.32 | $44.59 | +$2.54 |
| Roper Technologies | ROP | 0.0646 | $355.90 | $22.98 | +$0.98 |
| Mobility Global | MBGL | 0.6128 | $20.80 | $12.75 | −$0.51 |
| Carlisle Companies | CSL | 0.0061 | $330.09 | $2.00 | $0.00 |
| Total Stocks | 29 positions | $9,397.14 | +$1,875.98 | ||
| Assumed Cash | −$2.55 | ||||
| Net Portfolio Value | $9,394.59 |
Reconstruction Method and Sources
- The June starting point comes from the published June 2026 portfolio review: 27 positions, $8,557.43 in stocks, −$2.55 cash, and $7,122.54 in aggregate cost basis.
- The recurring-investment rule is supported by the April 2026 review and by the way the May-to-June share counts and cost basis reconcile. The model adds $1 to each of the 26 dividend-paying June holdings on all 15 market sessions from June 18 through July 10. Waters receives no recurring purchase.
- The S&P Global spin-off uses the issuer’s 1:1 MBGL distribution terms, the information statement’s due-bill treatment, Robinhood’s statement that fractional MBGL shares would be retained, and the issuer’s 95.16% / 4.84% basis-allocation example. The eight modeled SPGI purchases through June 30 receive matching MBGL; the seven SPGI purchases beginning July 1 do not.
- Carlisle is inferred from the D.27 Carlisle report, published July 9. The model adds $1 on July 9 and $1 on July 10. The article itself does not explicitly confirm that a purchase occurred.
- July 10 values use historical unadjusted closing prices. Estimated recurring purchases and dividend reinvestments use the closing price on each modeled execution date. Pre-spin SPGI purchases use the actual cum-distribution close rather than the vendor-adjusted historical series. Actual Robinhood executions would have occurred intraday, so the true fractional share counts would differ slightly.
- Dividend rates use declarations available by July 10. Examples include UnitedHealth’s $2.32 quarterly dividend, Meta’s $0.525 quarterly dividend, and S&P Global’s $0.97 quarterly dividend.
- Pending-payment dates use the issuer schedules for Thermo Fisher, Intuit, Roper Technologies, and Mastercard.
- The estimate assumes no undocumented sales, manual purchases, fees, taxes, or changes to the −$2.55 cash balance.
This reconstruction is for portfolio recordkeeping and educational discussion. It is not investment advice.